How to Configure & Run #
Configure middleware.env file
Add into your configure file your IP address where docker is running.
Example
IPv4 Address.: 192.168.1.9
edit middleware.env–> APP_HOST=”http://192.168.1.9:8081” After change verify devaten is running on this same address. http://192.168.1.9:8081
LOGIN_USER_NAME=”Enter Dashboard username” After change verify devaten dashboard Username(Email).Enter correct username that you used in sign up to dashboard.
PASSWORD=”Enter Dashboard password” After change verify devaten dashboard Password.Enter correct password that you used in sign up to dashboard.

How to Use #
When the docker image is running, it is running on the local port 8999, which is the port you can use to start and stop a Devaten recording.
We expose 2 ports for Prometheus. The first is 9090 which is where the “targets” and “graph” for Prometheus are located. Also, the image will open the port 9091 that can be used to access information about the recording through Prometheus.
The image will export Grafana on port 3000.
Once the middleware is up and running, you can do the following API calls, API calls can be made through the address-bar in the browser:
You will see the following interface.
Set Username and Password to Prometheus. #
Step 1. Go to the prometheus folder. There is web.xml file. Open this file in using following command

> vi web.yml
Press i to insert.
In basic_auth_users sections you need add your username first and password which is in encrypted format.Click on this link –
https://bcrypt-generator.com/
In that you need to enter your password and click on encrypt button. Your password will be encrypted.


Copy this encrypted password and past it in basic_auth_users section after username like below and save file.
For save file press ESC button then type : wq and then press ENTER button .

Step 2. Open the Prometheus.yml file using the following command.

>vi prometheus.yaml
Press the i button to insert.
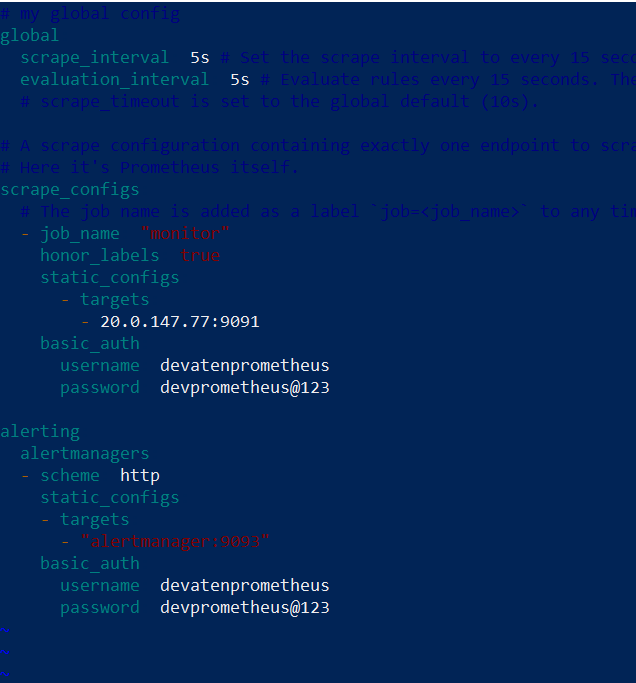
Scrape_config section there is basic_auth
Add your username and password. Username and password should be the same as the web.yml file. Here password is not required to encrypt.
Static_config section you need
to enter targets.
Your ip address follow by :9091
Eg. 20.0.147.77:9091
In the alerting section you also find basic_auth there also you need to enter username and password should be same like scrap_config basic_auth.
Press Esc Button. Then type :wq and then press Enter button to save file.
Start Recording #
localhost:8999/Start/{Usecase name}/{Application Identifier}
Ex. http://localhost:8999/Start/getCustomer/861632a7-7fde-46a1-b62b-eae111d00115
Usecase name can be anything that you choose. eg , Jmeter test this could your test suite name.
Application Identifier can be found in Devaten, under Applications and Application Management.
eg. 861632a7-7fde-46a1-b62b-eae111d00115

Stop Recording #
localhost:8999/Stop/{Usecase name}/{Application Identifier}
Ex. http://localhost:8999/Stop/getCustomer/861632a7-7fde-46a1-b62b-eae111d00115
Usecase name has to be the same as the name used to start the recording.
Application Identifier has to be the same as the application identifier used to start the recording.

Prometheus Graph #
a. ) Hit the Url ” localhost:9090 ” . You will see the following

b. ) select the metrics and execute by click on “Execute”
you will see the result in graphical form.