Devaten middleware installation guide #
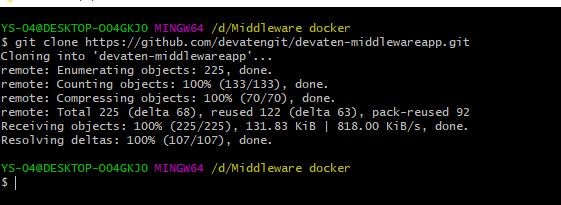
Step 1. Clone the Middleware file from Github using following command.
git clone https://github.com/devatengit/devaten-middlewareapp.git
Step 1. Go to the devaten-middlewareapp folder

Step 2. Open middleware.env file.
Make below changes in middleware.env file
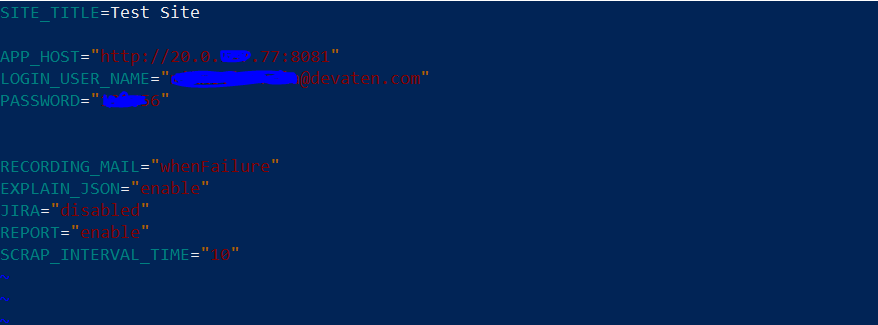
In APP_HOST section enter your azure instance public ip address on which On-Premises docker image running.
APP_HOST=”http://127.0.0.1:8081″
After the change verify Devaten is running on this same address. (if you use devaten sass then url should be https://app.devaten.com if you are use On-premise Docker-Compose Locally you have to change the HTTP URL with your system IP with port 8081 (http://127.0.0.1:8081/) in the middleware.env file. )
LOGIN_USER_NAME=”Enter Dahshboard login username”
PASSWORD=”Enter Dashboard login password”RECORDING_MAIL=”whenFailure”
EXPLAIN_JSON=”enable”
JIRA=”disabled”
REPORT=”enable”
SCRAP_INTERVAL_TIME=”10″
Provide Access permission #
To provide the access permission, open command prompt/terminal to the git checkout repository and follow the below steps

Give access to prometheus folder using following command.
> sudo chmod 777 -R prometheus/
Give access to grafana-data folder using following command
> sudo chmod 777 -R grafana-data/
Set Username and Password to Prometheus. #
Step 1. Go to the prometheus folder. There is web.xml file. Open this file in using following command

> vi web.yml
Press i to insert.
In basic_auth_users sections you need add your username first and password which is in encrypted format.
Click on this link –
https://bcrypt-generator.com/
In that you need to enter your password and click on encrypt button. Your password will be
encrypted.


Copy this encrypted password and past it in basic_auth_users section after username like below and save file. For save file press ESC button then type : wq and then press ENTER button .

Step 2. Open the Prometheus.yml file using the following command.

Add your username and password. Username and password should be the same as the web.yml file. Here password is not required to encrypt.
Static_config section you need
to enter targets.
Your ip address follow by :9091
Eg. 20.0.147.77:9091
In the alerting section you also find basic_auth there also you need to enter username and password should be same like scrap_config basic_auth.
>vi prometheus.yaml
Press the i button to insert.
Scrape_config section there is basic_auth

Press Esc Button. Then type :wq and then press Enter button to save file.
GRAFANA datasource #
Step 1. Go to grafana-data folder
Step 2. Open datasource folder

Step 3. Open datasource.yml file using following command.
>vi dataSources.yml
Press i button for insert.
Step 4. Enter your host IP address in this file.

Step 5. Press Esc button then type :wq for save changes.
Make changes in docker-compose file. #
Step 1. Go to folder devaten-middlewareapp.

Open docker-compose.yml file using below command
> vi docker-compose.yml.
Press i button for insert.
Go to prometheus section where you find
Environment Enter your prometheus username and password.

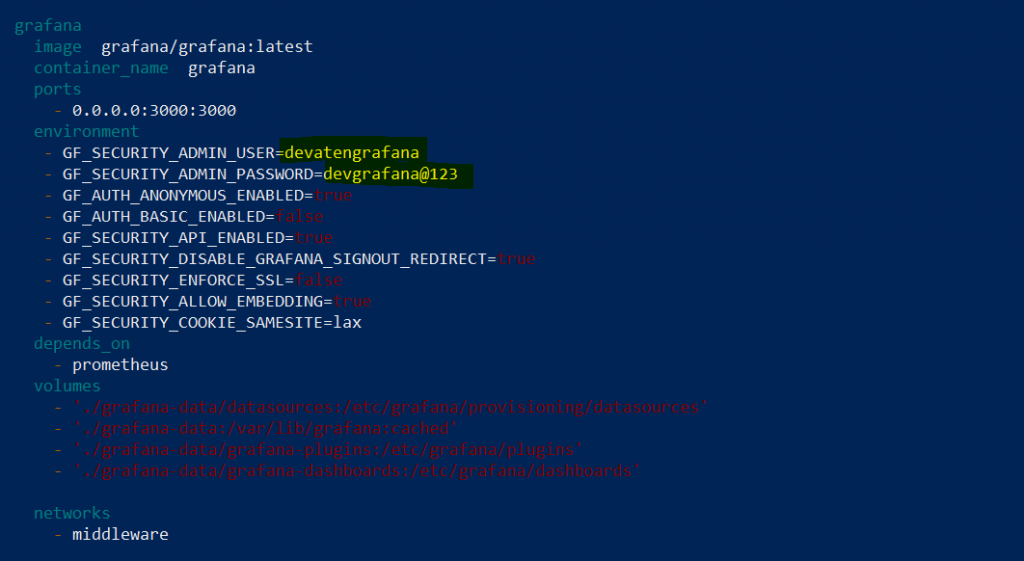
Go to the grafana section where you find environment . Enter your grafana GF_SECURITY_ADMIN_USER and GF_SECURITY_ADMIN_PASSWORD.
e.g
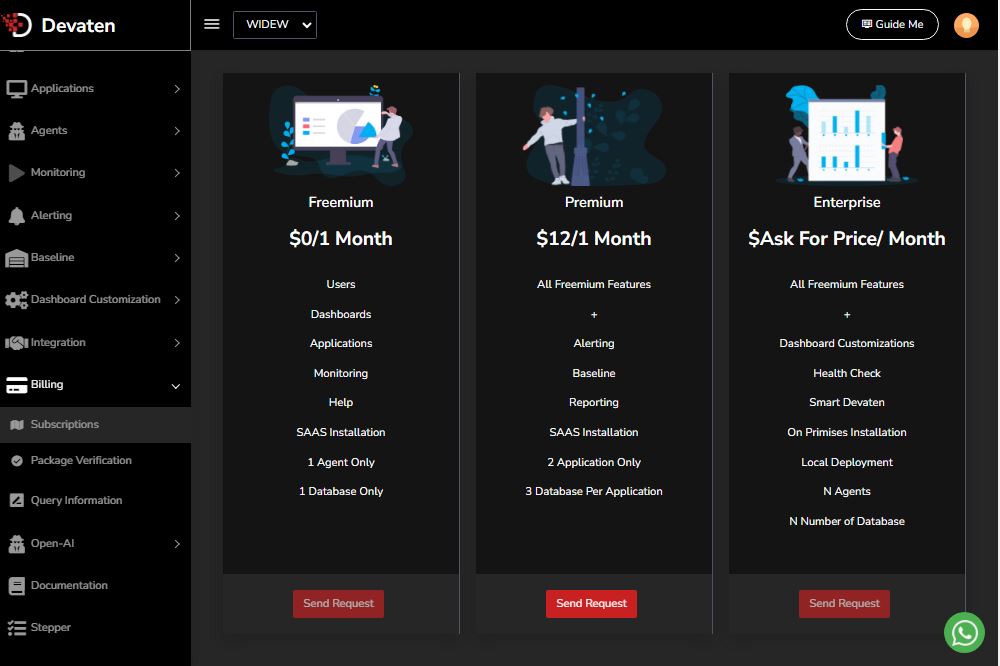
a. ) Activate Subscription key:
Active subscription from above option and send request . It will send verification code to your email.
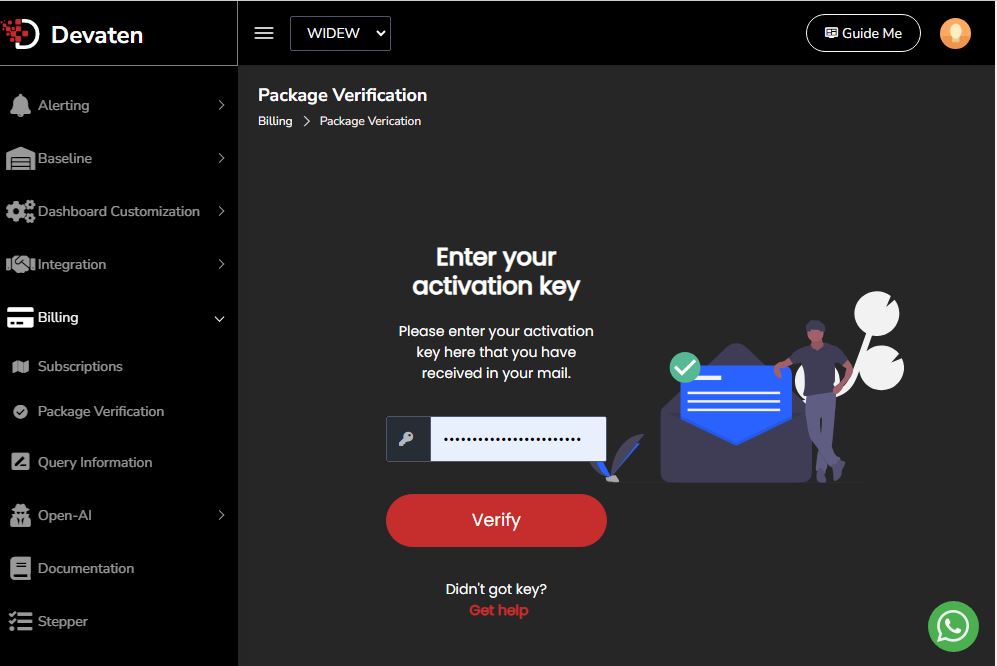
b. ) Verify subscription key:
Package verification option is available on sidebar ->Billing->package verification. Activate package by entering the activation key received on mail and verify the code.
Add Application #
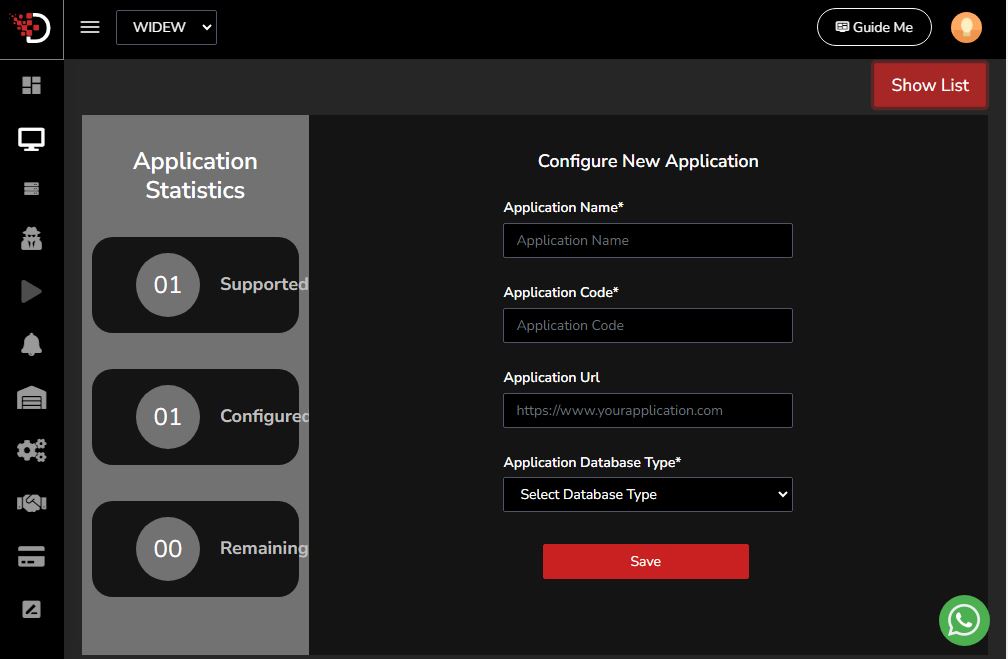
Here You can add Applications you can want to test. you can add number of Applications based on your subscription. You can add new application by doing below steps
a. ) On sidebar menu go to Applications -> Application management ->New Application
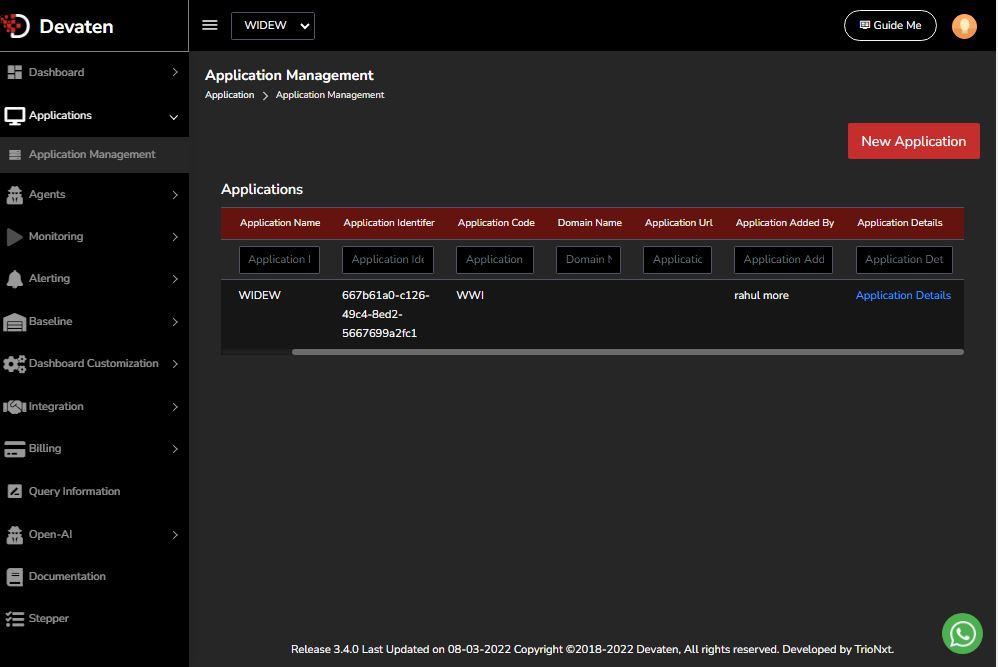
b. ) Enter application details :
You have to add all the details of the application which you want to configure for monitoring and save the connection.
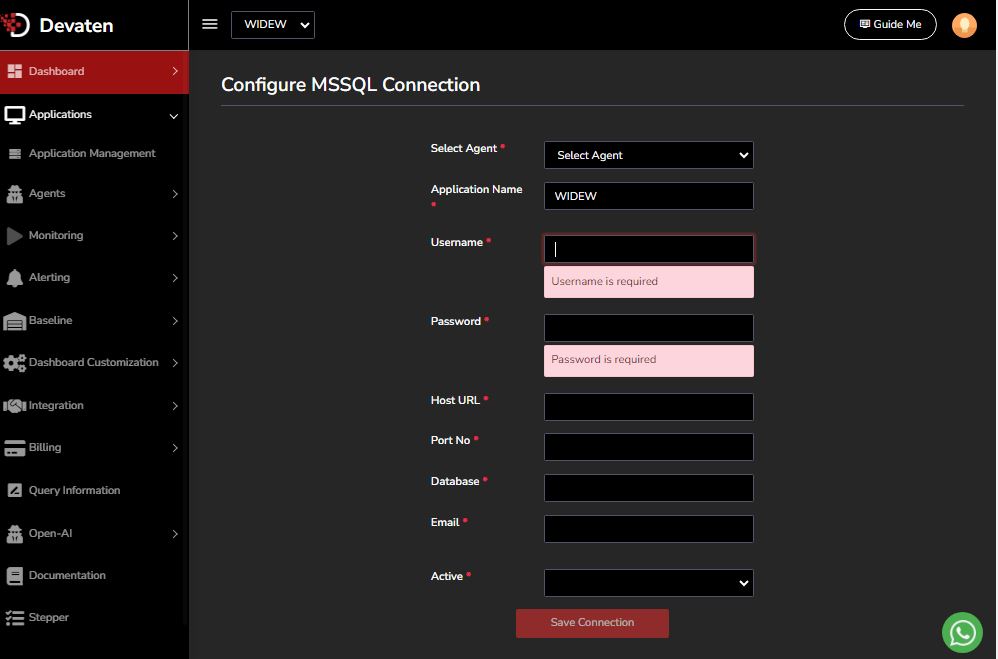
Configure Datasource: #
a. ) Configure your datasource by doing following steps
Go to Application -> Application Management ->Application details -> Add New Datasource. you will get the following interface.
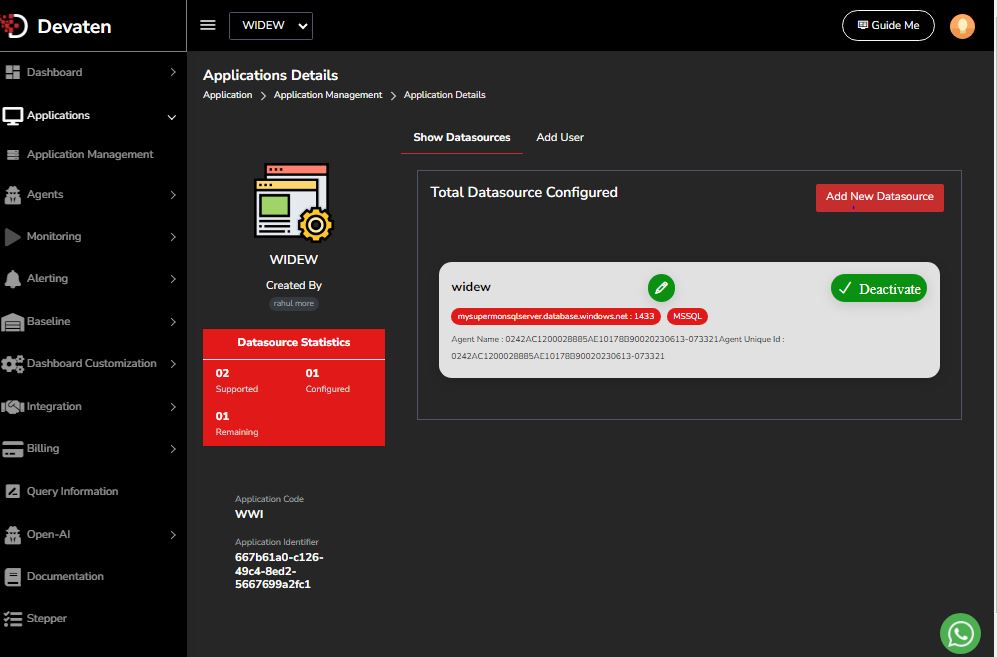
b. ) Enter the details:
Enter The required details about your datasource by enter the username , password, host name, port number, Database name of your database.
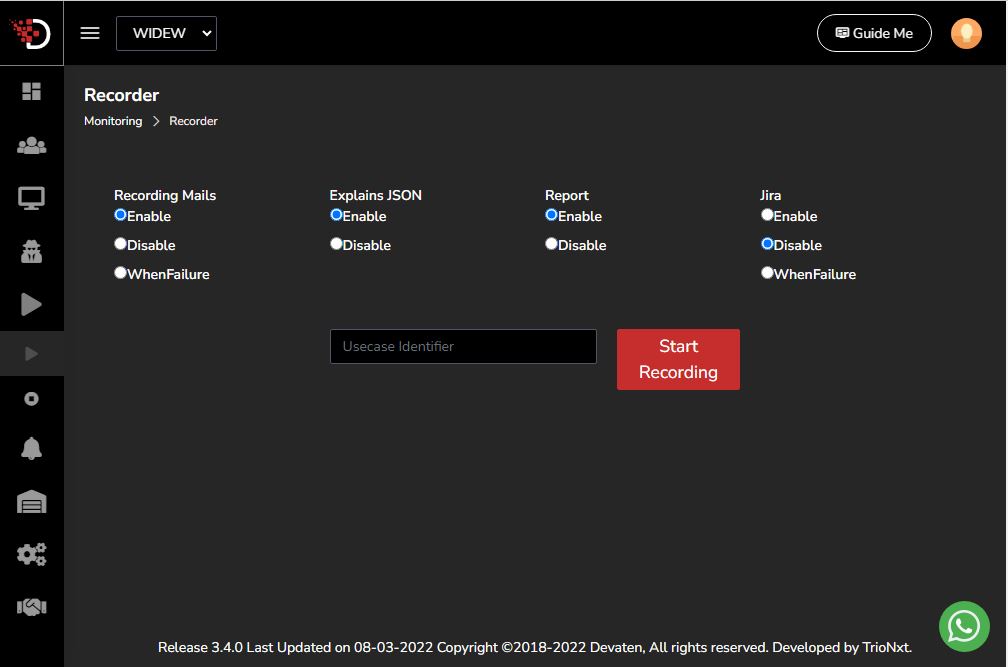
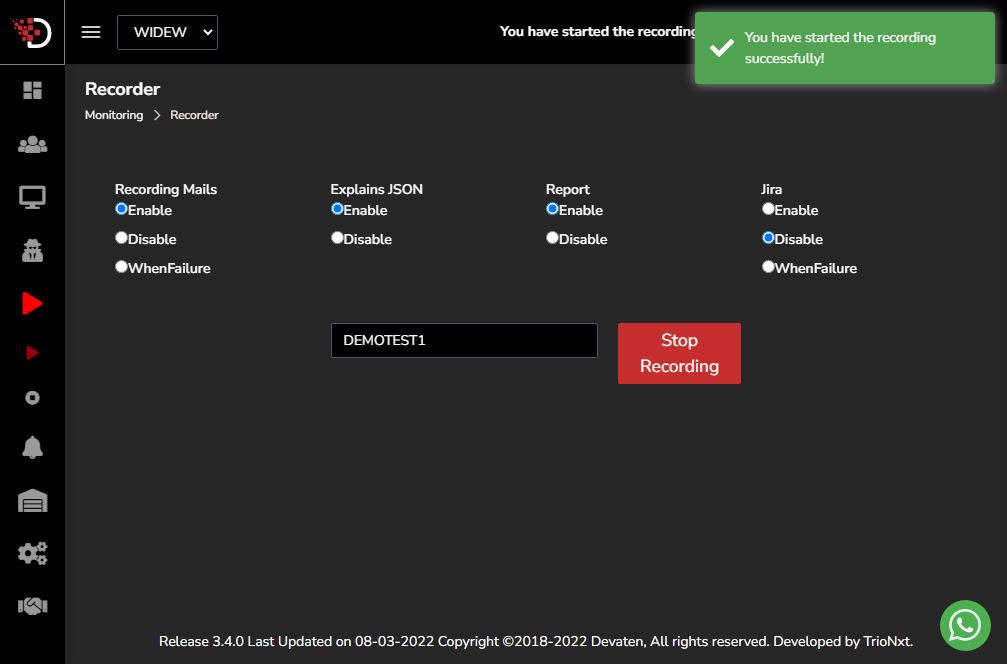
Start Recording #
Add the test-case from your database and start recording by click on “start Recording”
It will examine the queries which are executed between start and stop recording session.
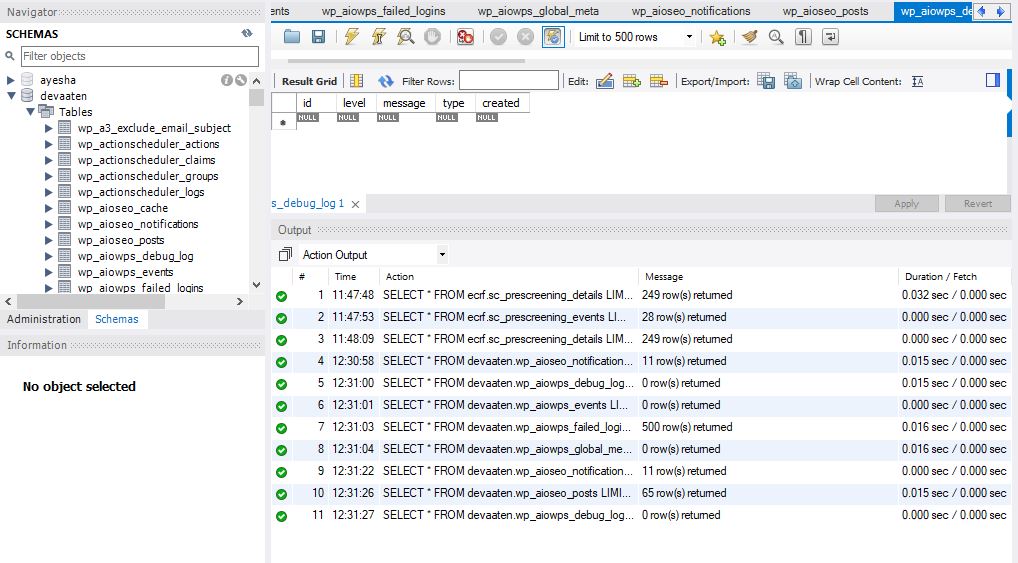
Execute Query #
Start your database and execute the queries for the schema which you have configured.
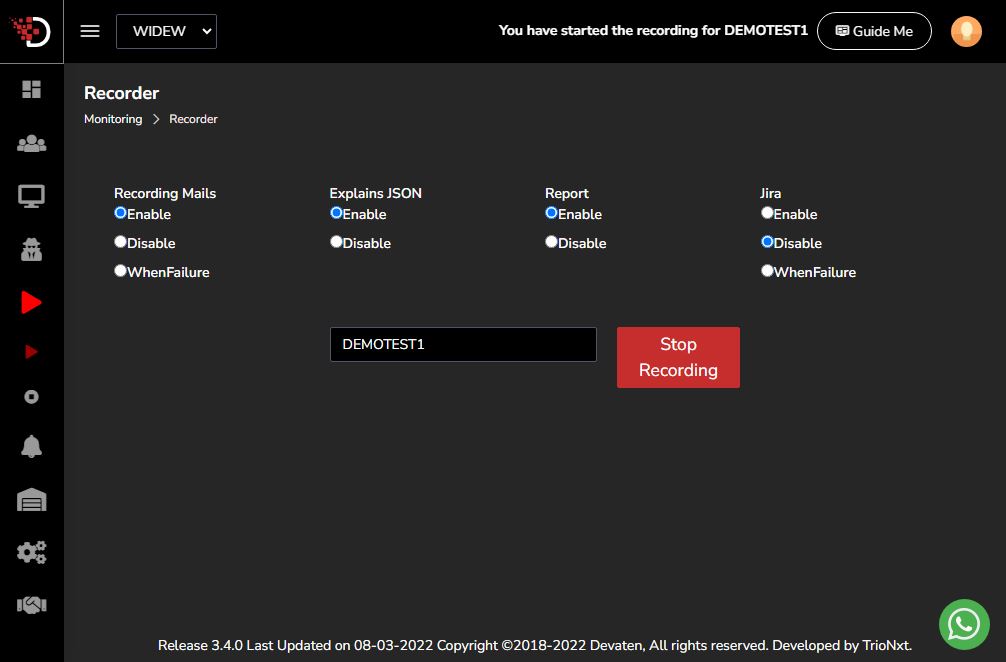
Stop Recording #
Execute the queries in your database and stop recording by click on “Stop Recording”
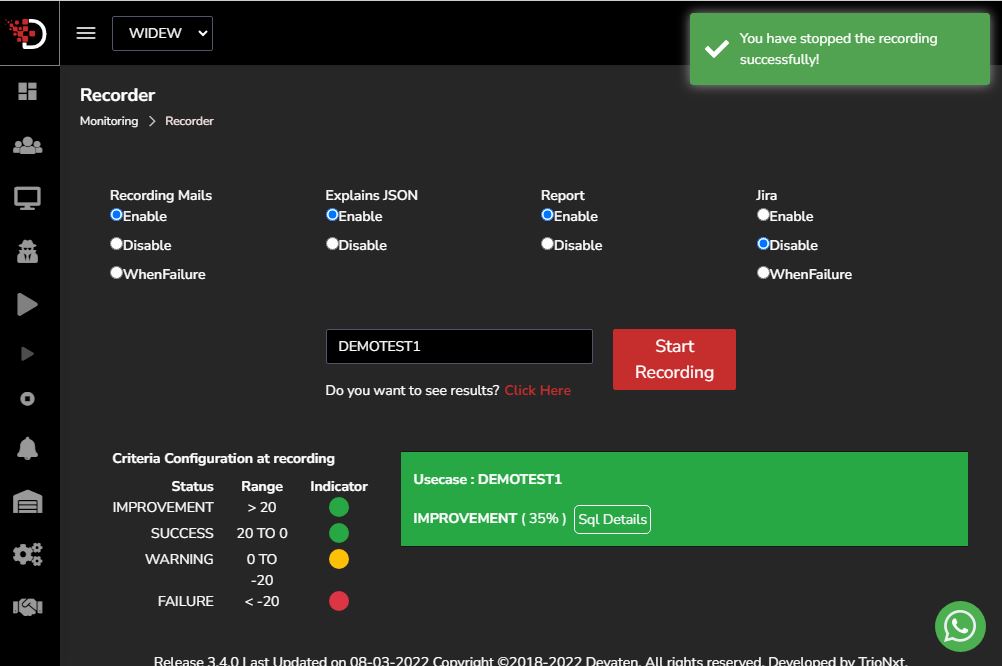
Use case Details #
You can see the use case details for your database
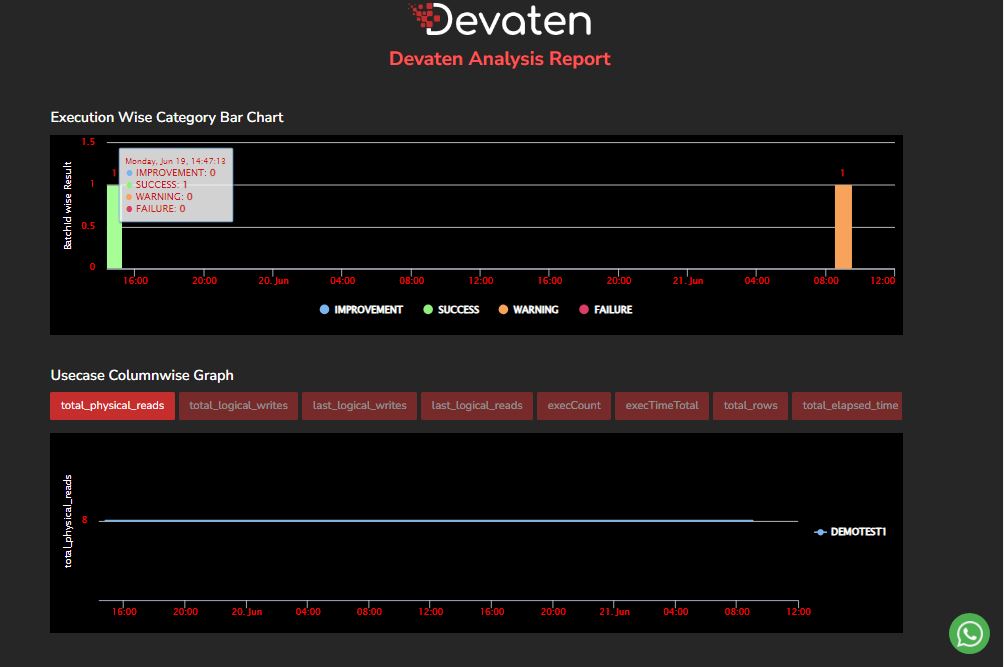
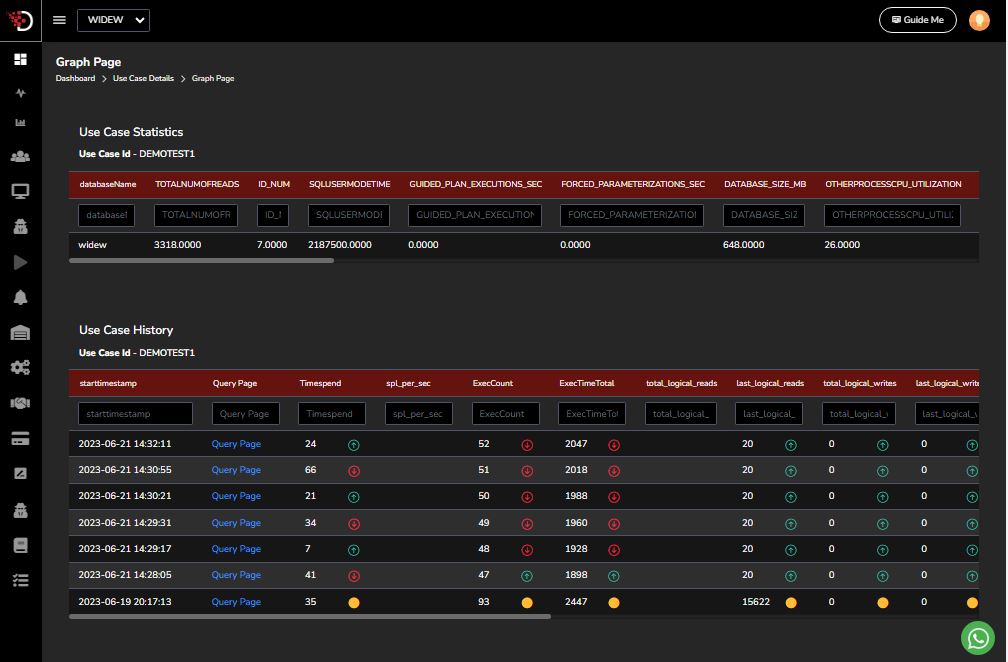
1 . Go to ->Dashboard ->Use case details ->Graph Page
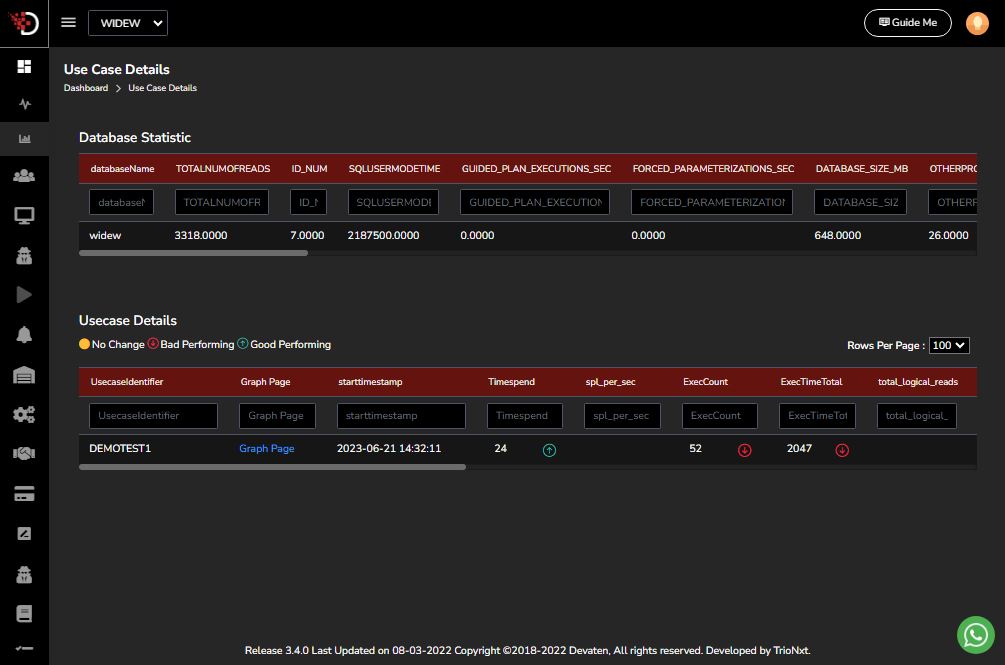
you can see your database performance in graph format. For that click on “Graph Page ” on Use case Details page.
2. Click on “Query Page”
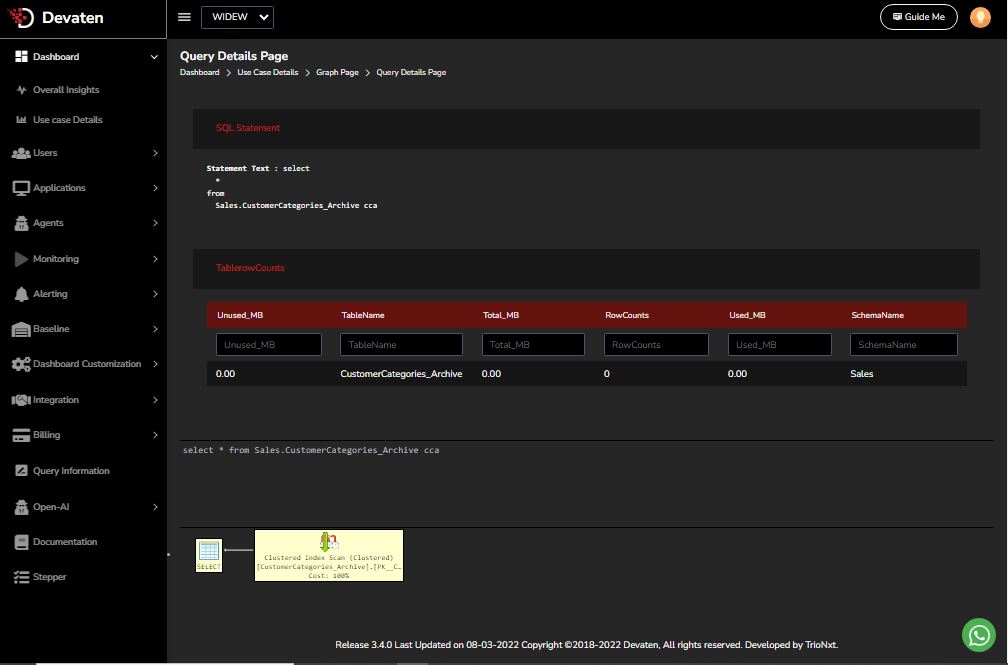
3. Click on “Details”
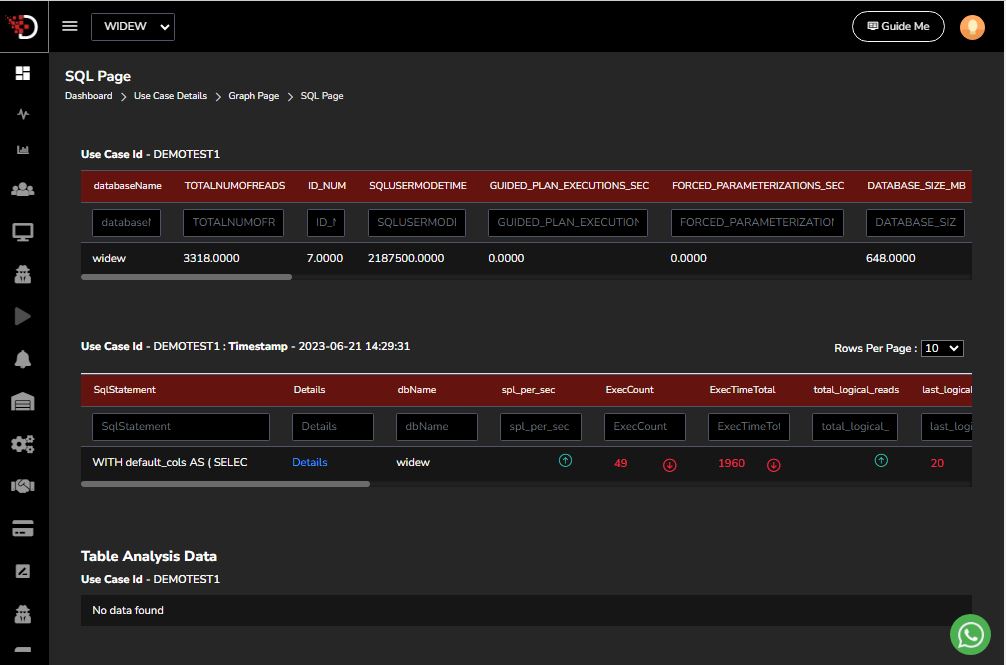
4. Here you can see “Query details” Page in which you will get Sql statements details.
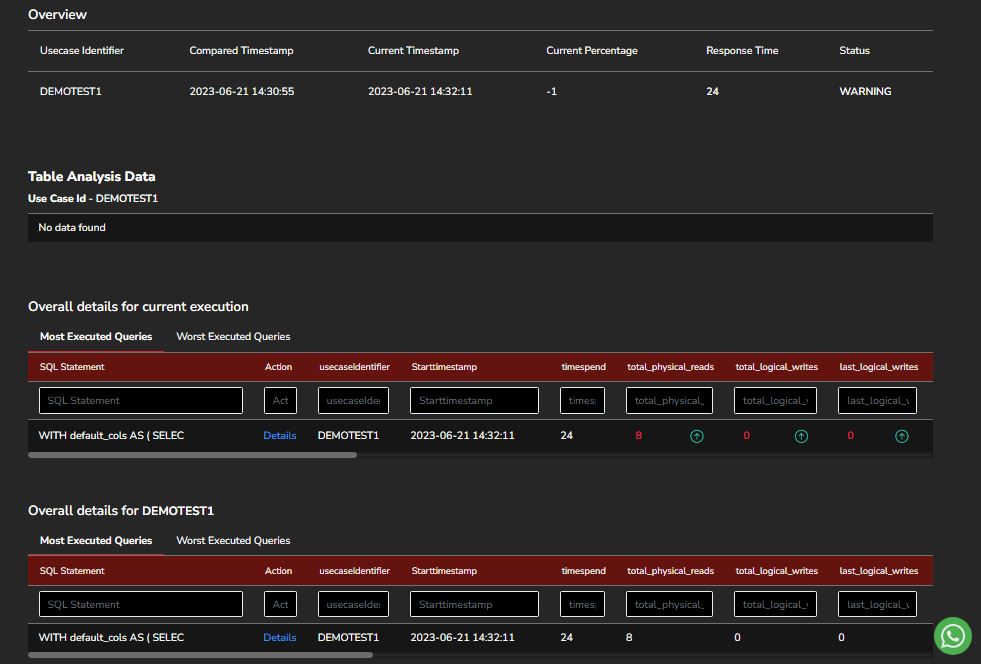
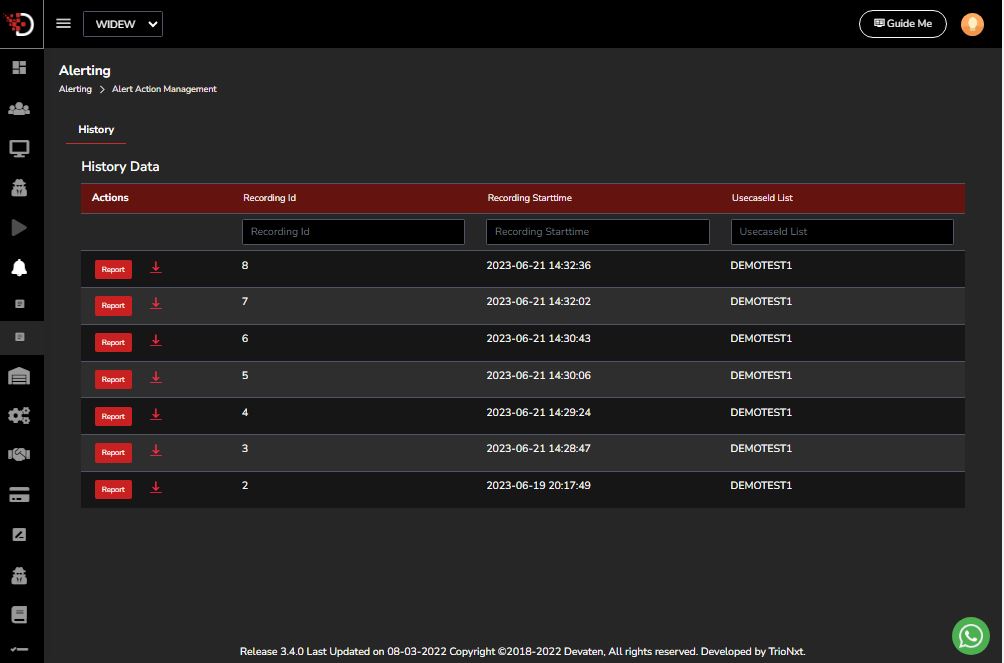
Download Report #
You can download and view report of your database performance
To download report go to ->Alerting -> History
You can view by clicking on “Report” and also download by click on download icon.
Sample Report View