JMeter
JMeter is a Java-based desktop application that can be used for performance testing of different kinds of client-server applications like websites, web services, databases, FTP servers, etc. It is an open-source tool provided by Apache with no licensing cost.
How to call web services of your application in Devaten–
Prerequisites–
- Registration on Devaten application
- REST API of Devaten application
- Your own application web services.
- JMeter setup
Step 1- Go To app.devaten.com and login to the devaten dashboard. Add your agent, application and datasource of your application which performance you want to monitored. This is link for how to add agent, application and datasource.
Step 2- Now in order to do the start recording to check the performance of your web services, start your Jmeter.
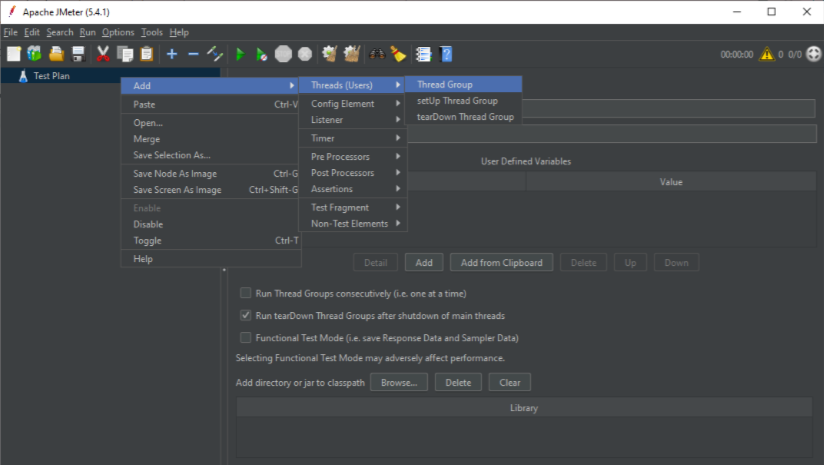
Step 3-First create the Test plan and save it. Now create the thread group and give proper name to that i.e. Thread Group-Start_Recording
Step 4- Add HTTP Request Sampler and add start recording api request to the Thread Group-Start_Recording. This is start recording API-
https://devaten.com/how-to-use-jmeter-with-devaten/
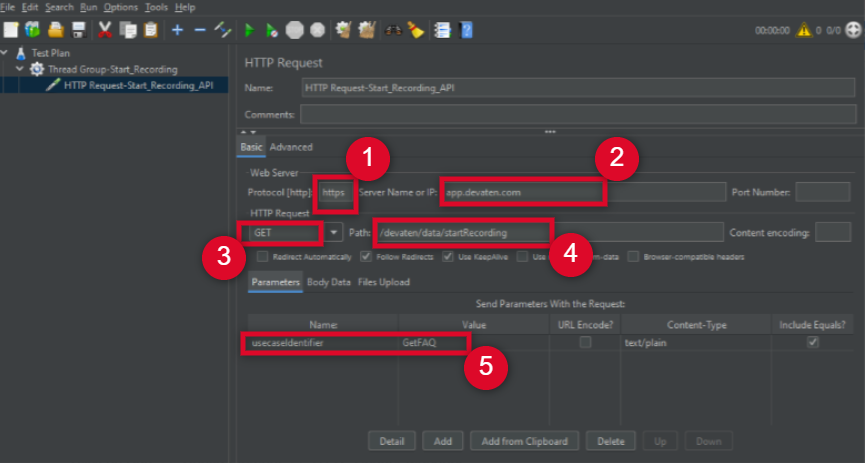
Select the Basic tab and add details of the start recording API -.
- Add protocol- https
- Add server name- app.devaten.com
- Add HTTP Request method- GET
- Add Path- /devaten/data/startRecording
- Add Parameter and Value- The start recording api accepts one parameter i.e usecaseIdentifier and give any meaningful value to that parameter.
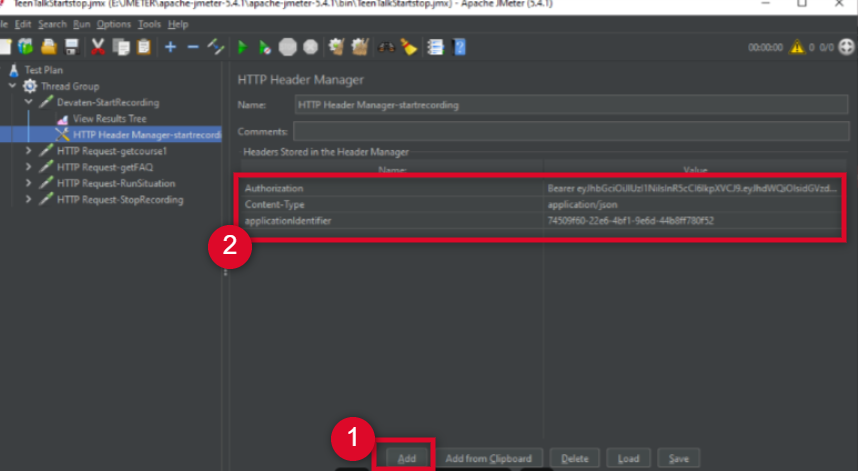
Step 5- Add Request header parameter to start recording API. Right click the http request ->> Click on Add ->> Config Element ->> HTTP Header Manager.
- Add Authorization parameter and its value-
To get Authorization token. Login to app.devaten.com with your credentials in browser, On the Devaten dashboard there is Integration tab under this Access Token sub tab, click on it you will get your access token and copy the token from here paste in the Request Header Manager.

- Second Request Header parameter is Content-Type and its value is application/json.
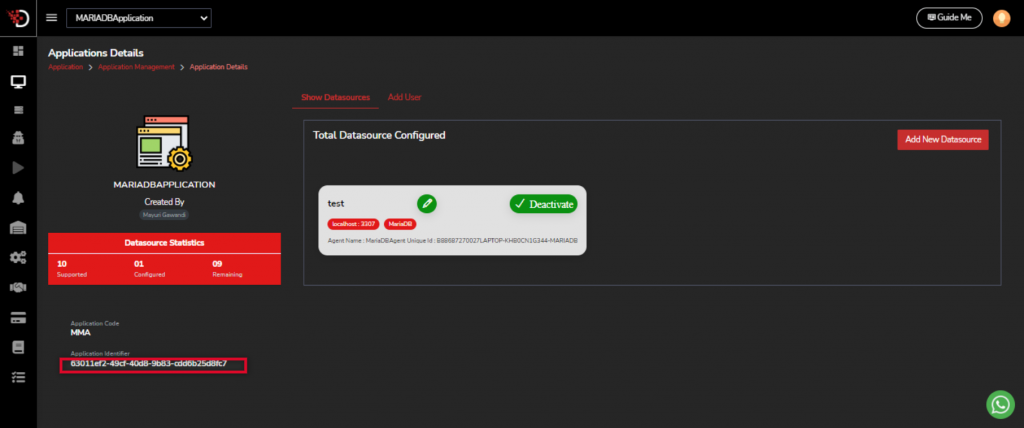
- Third parameter is applicationIdentifer. You will get the applicationIdentifier value in Application Details page.
Step 6- Add Authorization, Content-Type and applicationIdentifier request header parameters to the Request Header Manager.
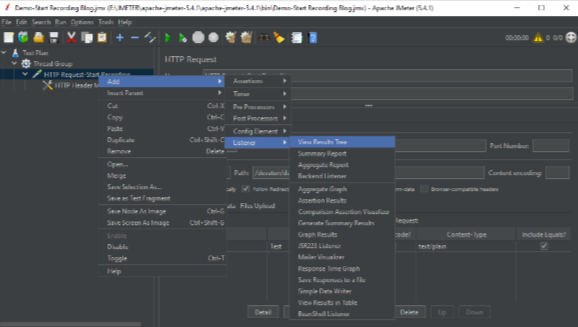
Step 7- To see the result of your request after run. Add the view result tree listener to your request in this way-
Right click on the HTTP Request ->> Click on Listener ->>Click on View Result Tree
Step 8- After start recording now execute your application’s web services which performance your want to monitor. Create a new Thread Group and give appropriate name to this thread group. Add your application’s web service API, request parameters and listener to the thread group.
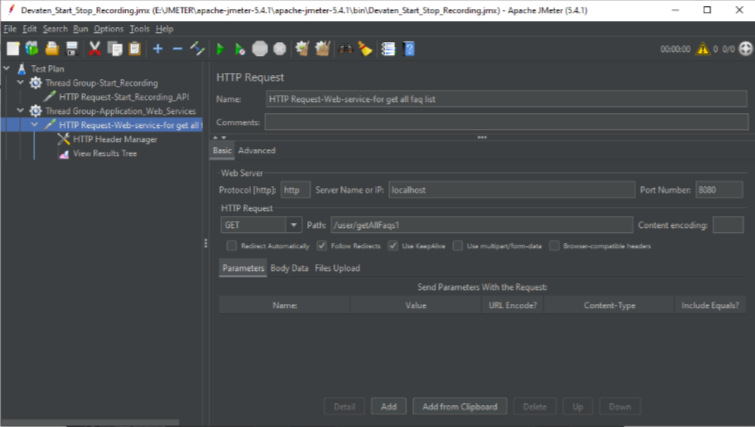
In above screenshot Thread Group-Application_Web_Services is thread group and I have added my application’s web service and its header parameters.
Step 9- Add runsituation API of devaten. Create a new thread group and add runsituation http request to the created thread group.
This is runsituation API of Devaten-
https://app.devaten.com/devaten/data/getRunSituation.
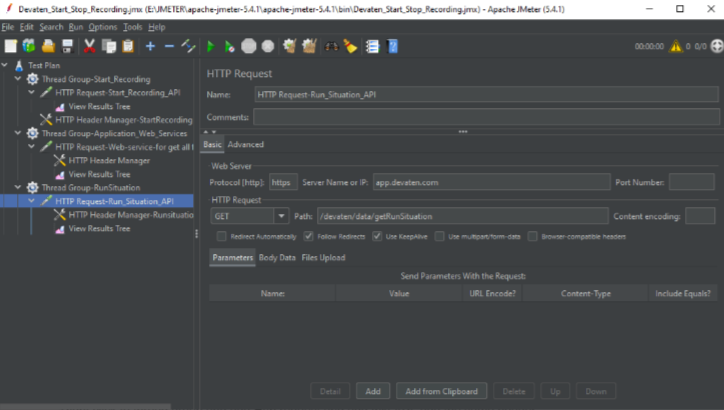
Add the same header parameter added to start recording i.e. Authorization, Content-Type and applicationIdentifier. Add View Result Tree to see the result.
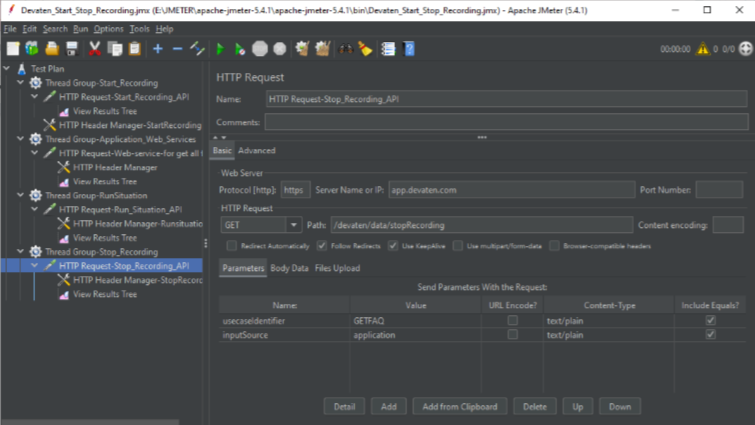
Step 10- Call the stop recording API of Devaten to stop recording. Again create new thread group and add the stop recording API request in thread group.
This is stop recording API
https://app.devaten.com/devaten/data/stopRecording?usecaseIdentifier=GETFAQ&inputSource=application
This API request accepts usecaseIdentifier and inputSource as parameters. For usecaseIdenfier value is same that you passed in start recording and inputSource value is application. Also add the same request header parameter i.e Authorization, Content-Type and applicationIdentifer added to the start recording. Add View Result Tree listener.
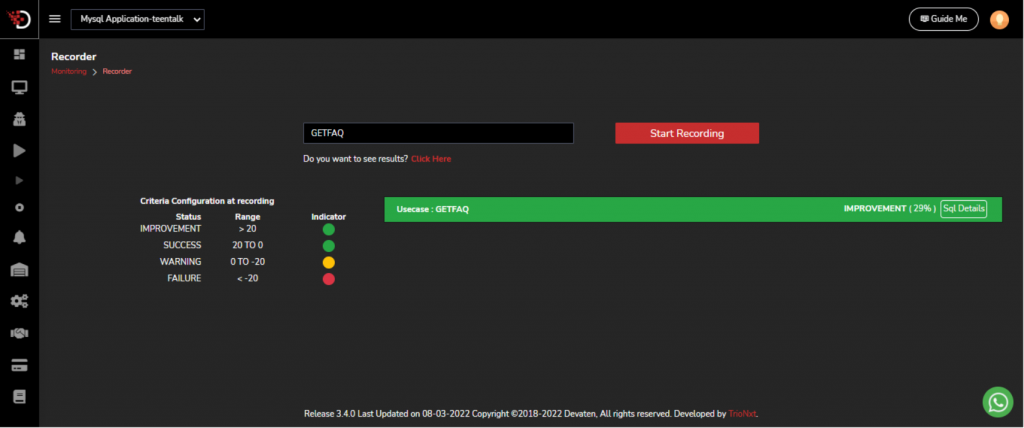
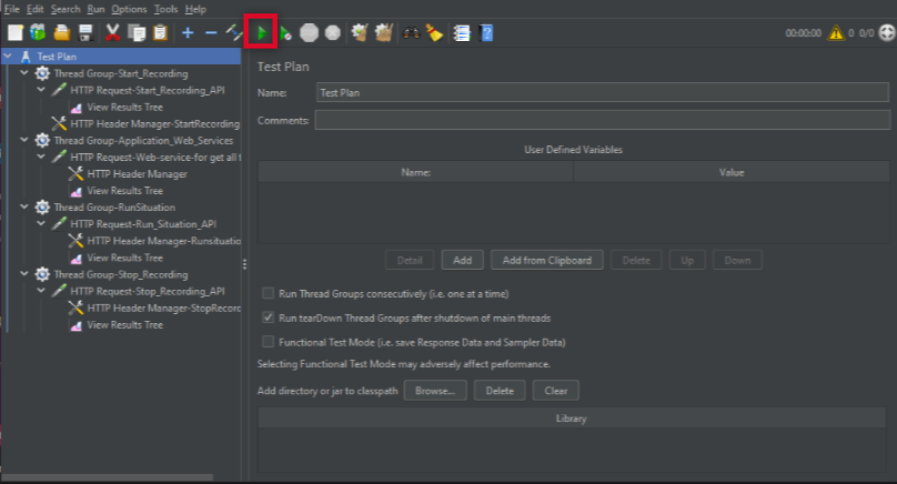
Step 11- Run the jmeter script. To run the script click the run button in header. After running script check the result in view result tree. Go to devaten dashboard click on sql details to see usecase details.
Step 12- After successfully run the jmeter script the usecase details are shown on the Devaten dashboard.