At Devaten, we understand the importance of an efficient and reliable Database Management System (DBMS) for maintaining the security, integrity, and consistency of your valuable data. Our expertise lies in optimizing the performance of SQL Server, a versatile software that offers both graphical user interface (GUI) and command-based functionalities.
With Devaten, you can unlock the full potential of your SQL Server, leveraging its powerful features to streamline your data management processes. Our solutions are designed to enhance performance, reliability, and scalability, enabling you to achieve optimal results for your business.
Devaten offers a powerful solution to identify and accelerate slow-moving queries. Leveraging the speed and efficiency of SQL, our platform enables users to retrieve data rapidly and effectively. Unlike unstructured databases like MongoDB, SQL provides a structured and relational approach to data organization.
With Devaten, you can unlock the full potential of SQL by quickly identifying and optimizing slow queries. Our solutions streamline operations, allowing you to execute queries, insert, delete, manipulate, and perform calculations on data in a matter of seconds. Experience enhanced query performance and maximize the efficiency of your database with Devaten.
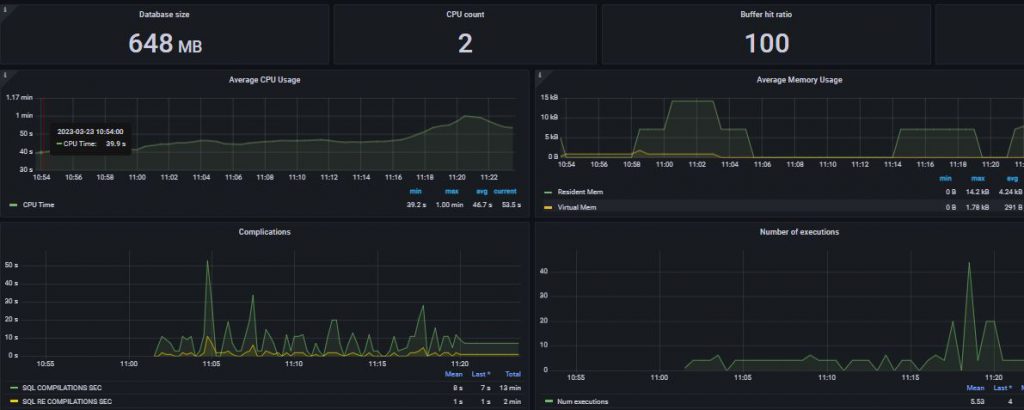
OS SYS Information
Monitor Key Database Metrics Alongside the Rest of Your Stack
Effortless Database Monitoring with Devaten.
Devaten simplifies the monitoring of key database metrics, seamlessly integrating with your entire technology stack. Our platform eliminates the need for extensive coding skills, making data extraction hassle-free. With SQL, you can maintain and monitor database systems without the requirement of writing complex code.
Experience the ease of managing your database systems with Devaten. Say goodbye to intricate lines of code for data extraction and effortlessly monitor your key metrics with our user-friendly platform.
Information about basic I/O operations
Devaten: Maximize SQL Performance & Efficiency
Resolve SQL issues quickly. Manage multiple databases securely. Enhance visibility across your stack.
Experience the power of Devaten for optimized SQL performance.
DatabaseStats
Enhance App Reliability & Collaboration Across Teams
Devaten: Enhancing App Reliability and Collaboration.
Accelerate Root Cause Diagnosis and Enhance Collaboration.
Devaten empowers you to diagnose root causes faster by correlating query metrics with database and infrastructure metrics. Our platform enables you to identify anomalous behavior across all your systems, streamlining troubleshooting efforts and improving overall app reliability. Collaboration is enhanced as teams can easily access query metrics without requiring explicit database access for every user.
Ensure Data Security and Privacy.
TOP 20 SQL detail
Monitoring That’s Simple to Deploy and Effortless to Manage
Effortless Monitoring for Your Infrastructure.
Easily track tens of thousands of metrics right from the start.
Intuitive user interface for seamless adoption across your organization, no query language needed
No professional services or extensive training required for deployment and monitoring.
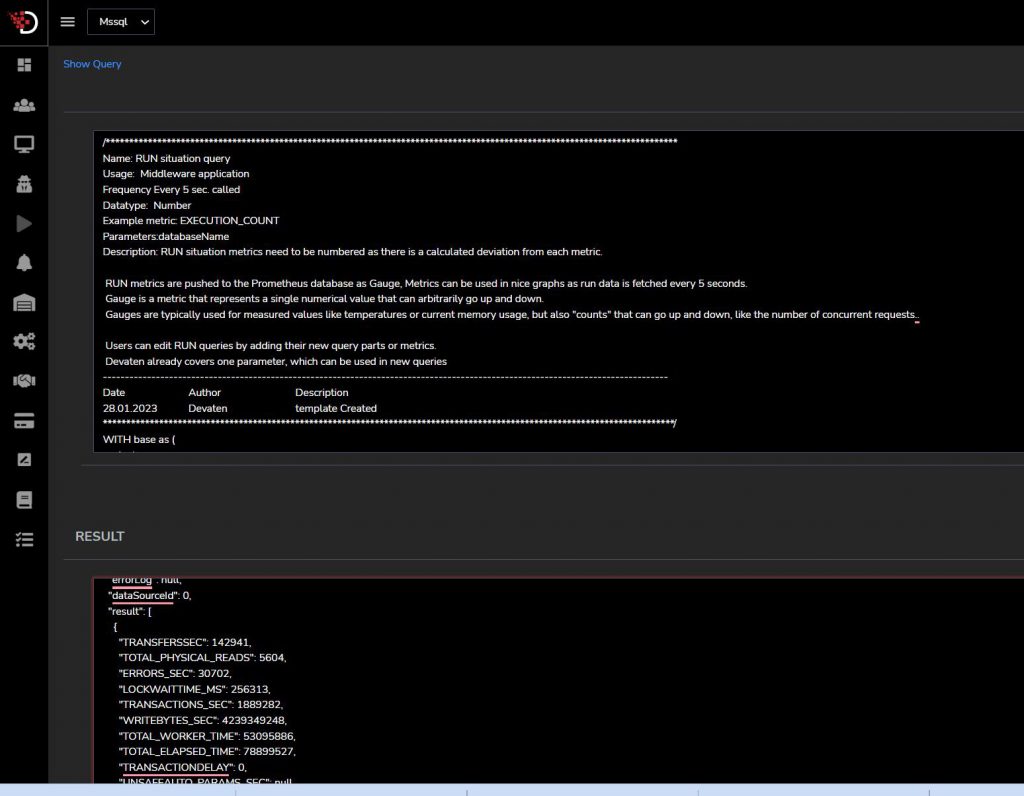
Devaten Edit Query
Customize Queries for Efficient Analysis
At Devaten, we give you the power to optimize your monitoring experience. Edit queries for the monitoring server or an ODBC-compliant database to tailor them to your requirements.
Why Modify Queries?
By adding filters and excluding unnecessary data, you gain a streamlined view of the information you need. This enhances data retrieval speed and efficiency, eliminating delays.
Unlock Customization Potential
With Devaten, customize queries to your preferences. Refine parameters, add filters, and fine-tune data output for a monitoring process that meets your unique needs.
Explain
Customize Queries for Efficient Analysis
At Devaten, optimize your monitoring experience by editing queries for the monitoring server or an ODBC-compliant database. Add filters to streamline data and enhance retrieval speed.
Unlock Customization Potential
With Devaten, tailor queries to your preferences. Refine parameters, add filters, and fine-tune data output for a customized monitoring process.
Alerting
Streamline Event Monitoring and Automation with SQL Server Agent
SQL Server Agent simplifies event monitoring in Windows environments. It generates events logged in the application log and triggers automated responses based on defined alerts. Benefit from enhanced event management and proactive actions for a reliable system.
Simplify event monitoring and automate responses with SQL Server Agent
Established in 2013 as a software consultancy company, Devaten has worked with finance and healthcare businesses to enhance their software development projects. Taking its offerings to the next level, Devaten built a leading use case-based database application monitoring tool, with a unique approach to performance improvement early during software development. Headquartered in Turku, Finland.