SAP HANA (High-performance ANalytic Appliance) is a multi-model database that stores data in its memory instead of keeping it on a disk. The column-oriented in-memory database design allows you to run advanced analytics alongside high-speed transactions – in a single system. Why is this so important? Because it lets companies process massive amounts of data with near-zero latency, query data in an instant, and become truly data-driven. By storing data in column-based tables in main memory and bringing online analytical processing (OLAP) and online transactional processing (OLTP) together, SAP HANA is unique – and significantly faster than other database management systems (DBMS) on the market today.
SAP HANA works with an efficient speed. This high speed can boost the amount of data retrieval. It can give users a rapid and effective means to obtain, alter, or store data.
SAP HANA can quickly and efficiently retrieve a large volume of data records from a database. Compared to an unstructured database such as MongoDB, it is a relational database that can characterize the data in a structured way. Operations like insertion, deletion, querying, manipulation, and calculations on data via analytical queries in a relational database can be accomplished in a matter of seconds.
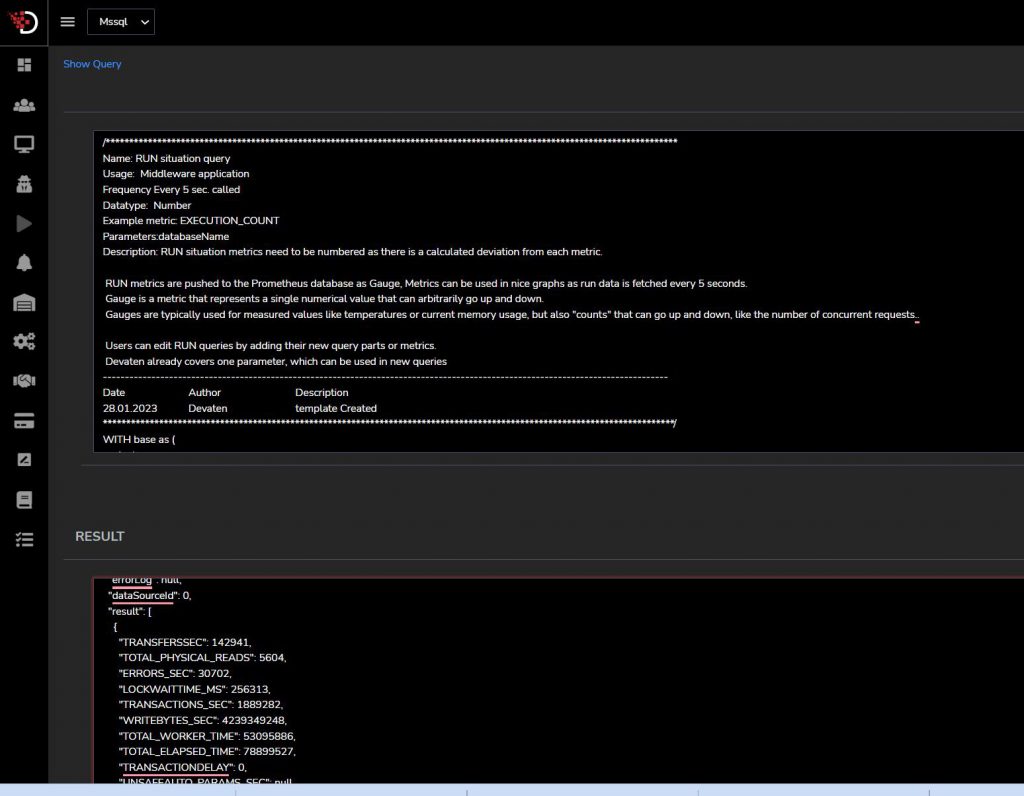
DB INSTANCE
Db instance query used by devaten start recording
DB INSTANCE metrics need to be numbers , Metrics present database or instance-level data. like Database Size Metrics are pushed to the Prometheus database as Gauge, Metrics are stable those are updated after each start recording, Gauge is a metric that represents a single numerical value that can arbitrarily go up and down.
Gauges are typically used for measured values like temperatures or current memory usage, but also “counts” that can go up and down, like the number of concurrent requests.
Users can edit monitoring queries by adding their new query parts or metrics.
Devaten already covers one parameter,databaseName can be used in new queries.
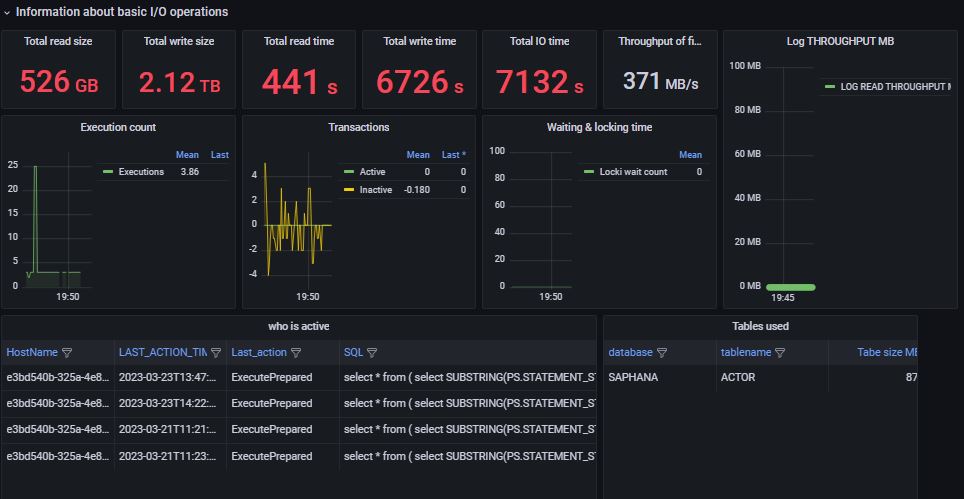
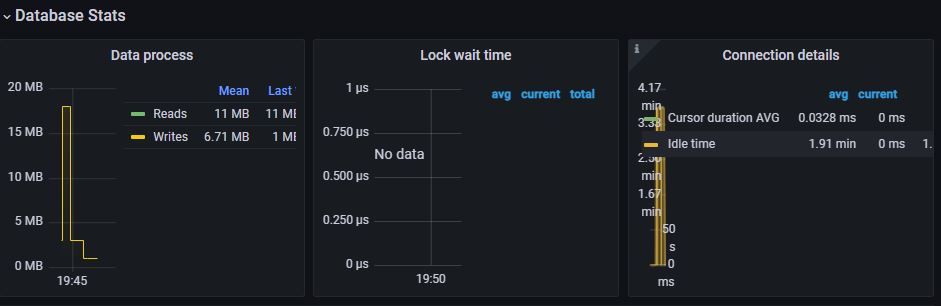
Information about basic I/O operations
Isolate SapHana query performance issues in minutes by visualizing query metrics over time
Reduce MTTR, prevent outages, and ultimately increase company revenue with our intuitive, no-code platform
Eliminate bottlenecks at the DBA level by managing many databases at once without compromising security
Break down silos and increase visibility by monitoring your entire stack all in one place
Devaten Edit Query
You can edit any of the queries you have created for the monitoring server or for an ODBC-compliant database. You might want to modify a query to add a filter that keeps unnecessary data from cluttering the view and slowing the return of data
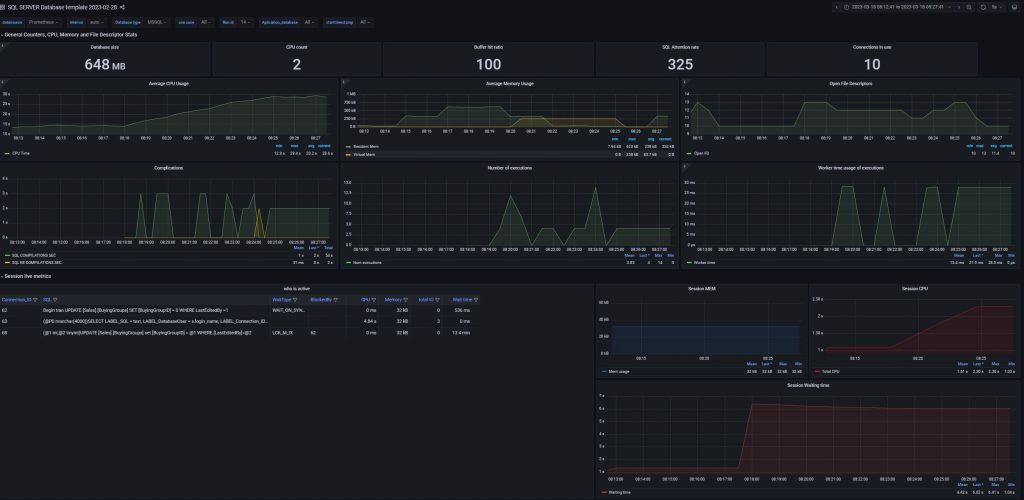
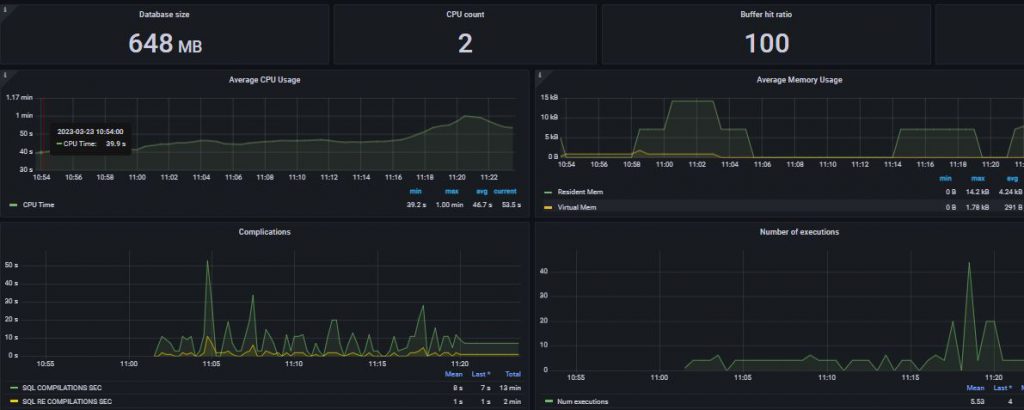
Database Stats
Enhance App Reliability & Collaboration Across Teams
Diagnose root causes faster and see anomalous behavior across all your systems by correlating query metrics with database and infrastructure metrics.
Expand your team’s access to query metrics without providing explicit database access to every user.
Keep sensitive data secure with automatic obfuscation of PII in explain plans and query metrics.
Scale DBM usage with your needs and manage a large number of databases securely.
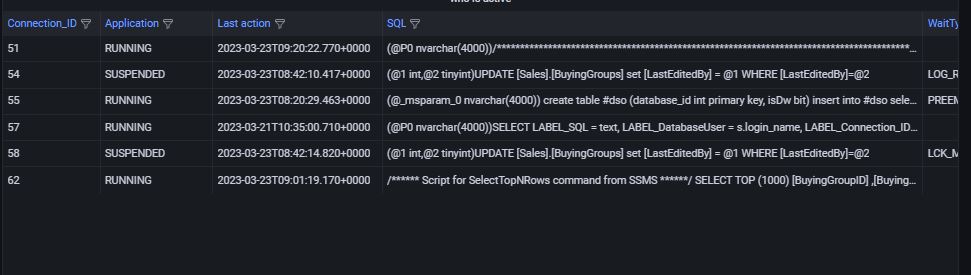
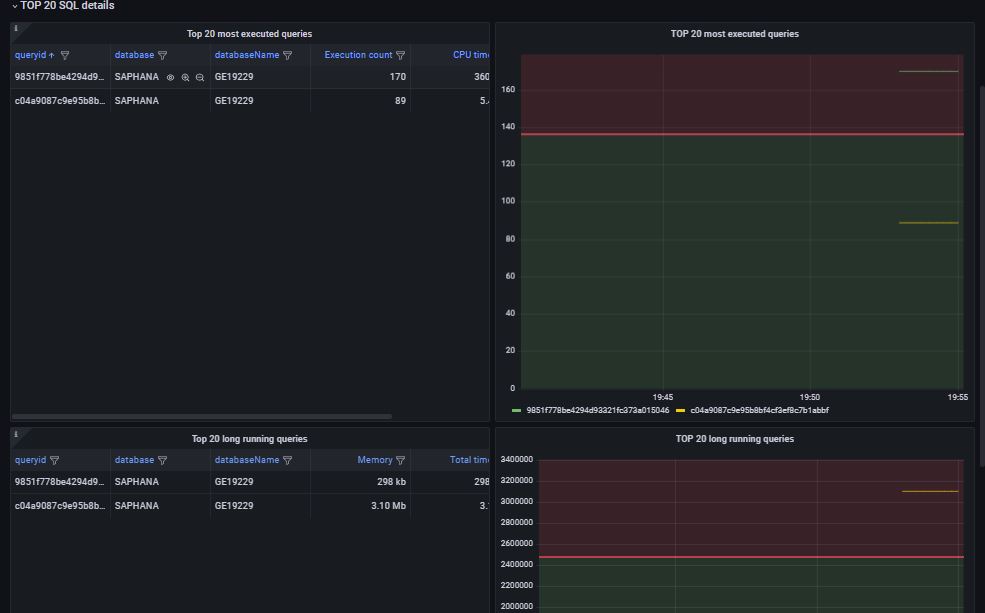
TOP 20 SQL detail
Monitoring That’s Simple to Deploy and Effortless to Manage
Track tens of thousands of infrastructure metrics out-of-the-box
Deploy and start monitoring without any need for professional services or extensive training
Promote adoption across your organization with our intuitive user interface that requires no query language and can be used by anyone