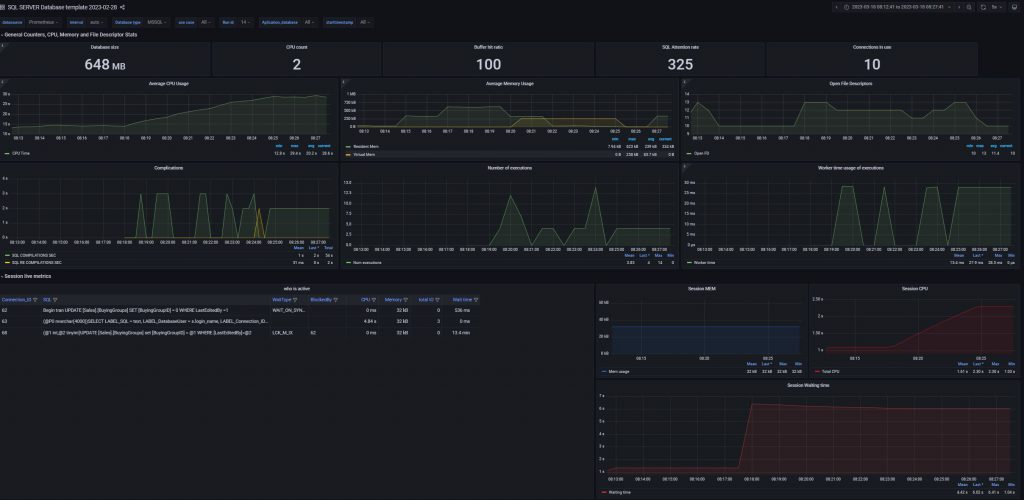
PostgreSQL is used as the primary data store or data granary for many webs, mobile, geospatial, and analytics applications. Devaten Agent to automatically aggregate metrics and make them visible on a customizable dashboard that shows you how these metrics evolve over time. As Postgresql’s have these features we are supporting for it in our application.
PostgresSQL works with an efficient speed. This high speed can boost the amount of data retrieval. It can give users a rapid and effective means to obtain, alter, or store data.
PostgresSQL can quickly and efficiently retrieve a large volume of data records from a database. Compared to an unstructured database such as MongoDB, it is a relational database that can characterize the data in a structured way. Operations like insertion and , deletion, querying, manipulation, and calculations on data via analytical queries in a relational database can be accomplished in a matter of seconds.
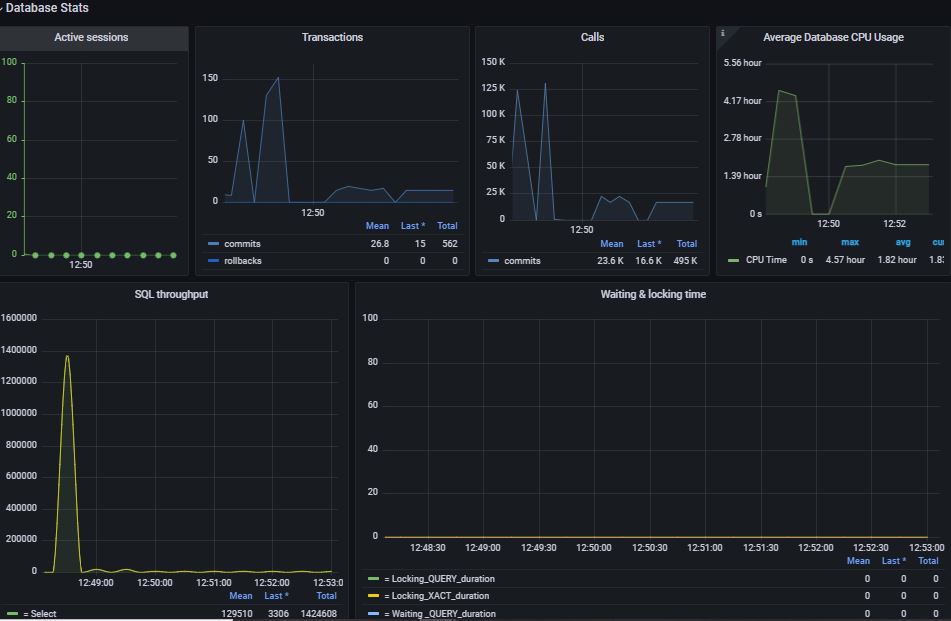
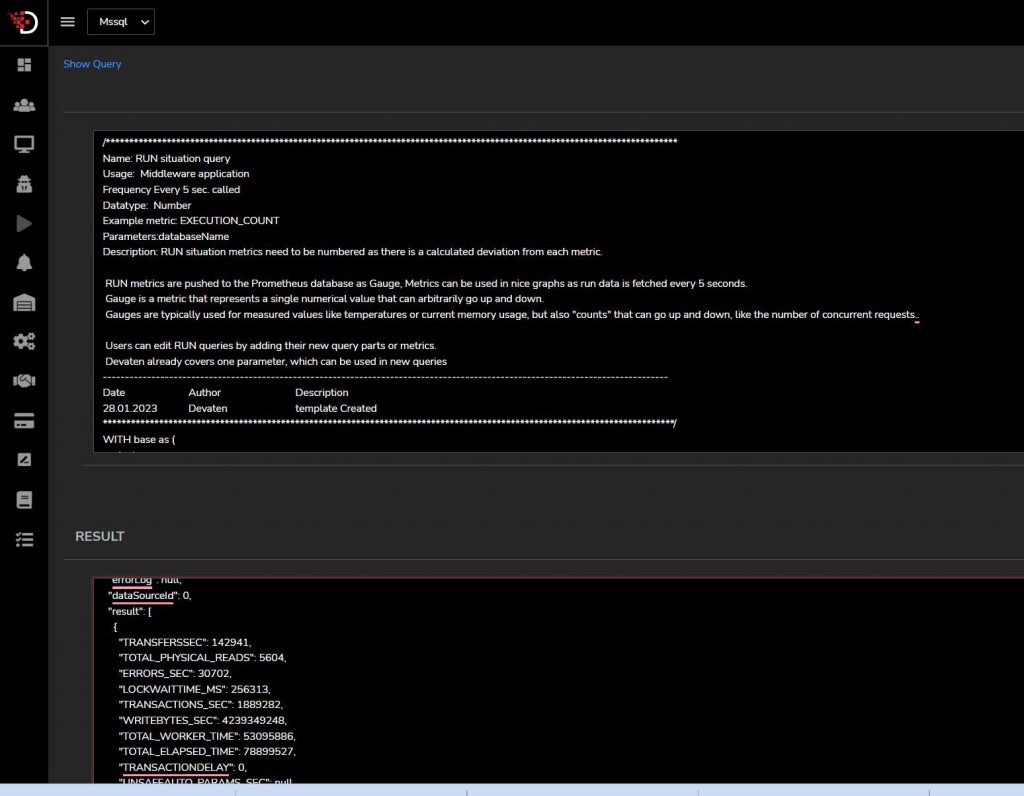
Database Stats
Enhance App Reliability & Collaboration Across Teams
Diagnose root causes faster and see anomalous behavior across all your systems by correlating query metrics with database and infrastructure metrics.
Expand your team’s access to query metrics without providing explicit database access to every user.
Keep sensitive data secure with automatic obfuscation of PII in explain plans and query metrics.
Scale DBM usage with your needs and manage a large number of databases securely.
OSSYS Information
Monitor Key Database Metrics Alongside the Rest of Your Stack
No Need for Coding Skills
There is no need for large and complex code lines for data extraction. One reason for using PostgresSQL is that it does not require extensive coding and program writing knowledge. It is easy to maintain database systems without having to write a good amount of code. There is no need for large complex lines of code for data extraction.
Devaten Edit Query
You can edit any of the queries you have created for the monitoring server or for an ODBC-compliant database. You might want to modify a query to add a filter that keeps unnecessary data from cluttering the view and slowing the return of data
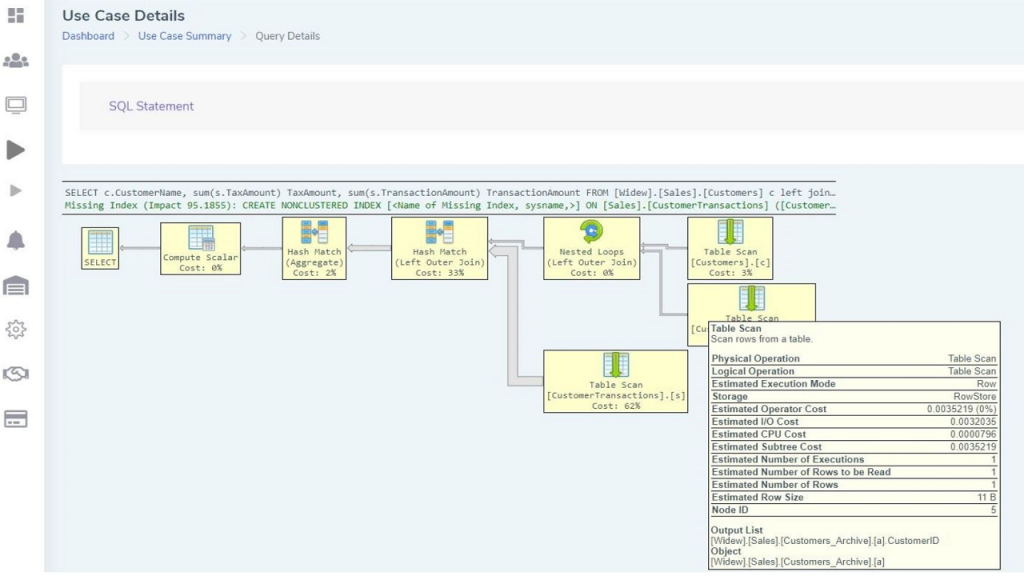
Explain
Devaten collects explain plans continuously, so a given query can have multiple plans in different recordings. Those plans are normalized and shown separately so that you can see if a query has plans that perform better or have higher relative cost than others. For example, the following shows explain plans for a query, and it also suggest to add index as recommendation
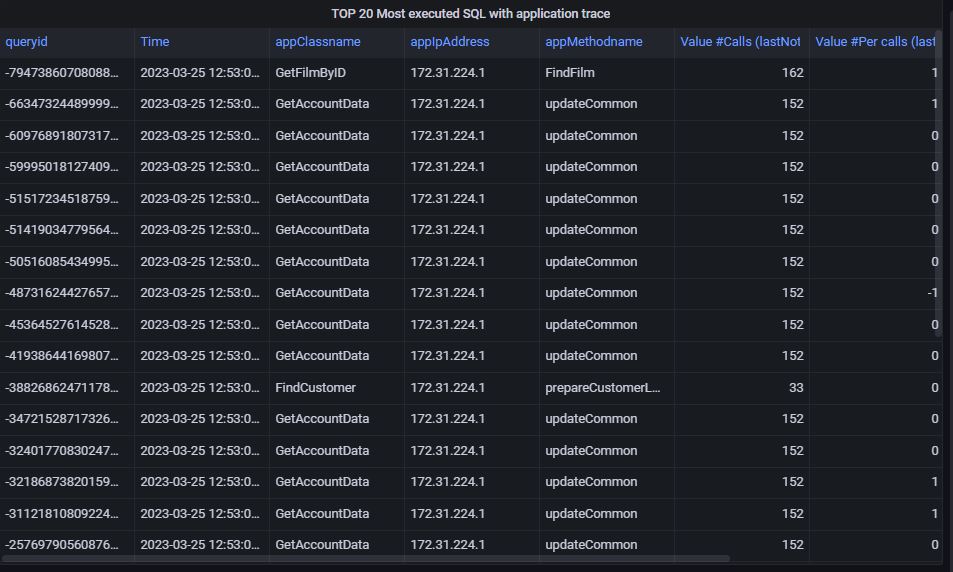
TOP 20 SQL detail
Monitoring That’s Simple to Deploy and Effortless to Manage
Track tens of thousands of infrastructure metrics out-of-the-box
Deploy and start monitoring without any need for professional services or extensive training
Promote adoption across your organization with our intuitive user interface that requires no query language and can be used by anyone
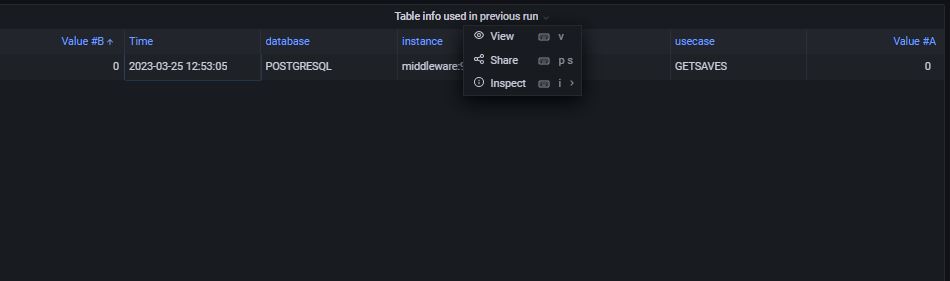
Table Information
To get the information of the tables of a database, we don’t need any permissions or privileges of the user. “Table information table” refers to checking the table structure. We can use various examples with variety in their usage leads to gain the description of the data. This will be understood by you while reading the article.