ETL Performance
- Home
- ETL Performance
ETL vendors benchmark their record systems at multiple TB (terabytes) per hour (or ~1 GB per second) using powerful servers with multiple CPUs, multiple hard drives, multiple gigabit-network connections, and much memory.
In real life, the slowest part of an ETL process usually occurs in the database load phase. Databases may perform slowly because they have to take care of concurrency, integrity maintenance, and indices. Thus, for better performance, it may make sense to employ:
- Direct path extract method or bulk unload whenever is possible (instead of querying the database) to reduce the load on source system while getting high-speed extract.
- Most of the transformation processing outside of the database
- Bulk load operations whenever possible
Still, even using bulk operations, database access is usually the bottleneck in the ETL process. Some common methods used to increase performance are:
- Partition tables (and indices): try to keep partitions similar in size (watch for
nullvalues that can skew the partitioning) - Do all validation in the ETL layer before the load: disable integrity checking (
disable constraint…) in the target database tables during the load - Disable triggers (
disable trigger…) in the target database tables during the load: simulate their effect as a separate step - Generate IDs in the ETL layer (not in the database)
- Drop the indices (on a table or partition) before the load – and recreate them after the load (SQL:
drop index…create index…) - Use parallel bulk load when possible — works well when the table is partitioned or there are no indices (Note: attempting to do parallel loads into the same table (partition) usually causes locks — if not on the data rows, then on indices)
- If a requirement exists to do insertions, updates, or deletions, find out which rows should be processed in which way in the ETL layer, and then process.
Whether to do certain operations in the database or outside may involve a trade-off. For example, removing duplicates using distinct may be slow in the database; thus, it makes sense to do it outside. On the other side, if using distinct significantly (x100) decreases the number of rows to be extracted, then it makes sense to remove duplications as early as possible in the database before unloading data.
A common source of problems in ETL is a big number of dependencies among ETL jobs. For example, job “B” cannot start while job “A” is not finished. One can usually achieve better performance by visualizing all processes on a graph, and trying to reduce the graph making maximum use of parallelism, and making “chains” of consecutive processing as short as possible. Again, partitioning of big tables and their indices can really help.
Another common issue occurs when the data are spread among several databases, and processing is done in those databases sequentially. Sometimes database replication may be involved as a method of copying data between databases — it can significantly slow down the whole process. The common solution is to reduce the processing graph to only three layers:
- Sources
- Central ETL layer
- Targets
This approach allows processing to take maximum advantage of parallelism. For example, if you need to load data into two databases, you can run the loads in parallel (instead of loading into the first — and then replicating into the second).
Sometimes processing must take place sequentially. For example, dimensional (reference) data are needed before one can get and validate the rows for main “fact” tables.
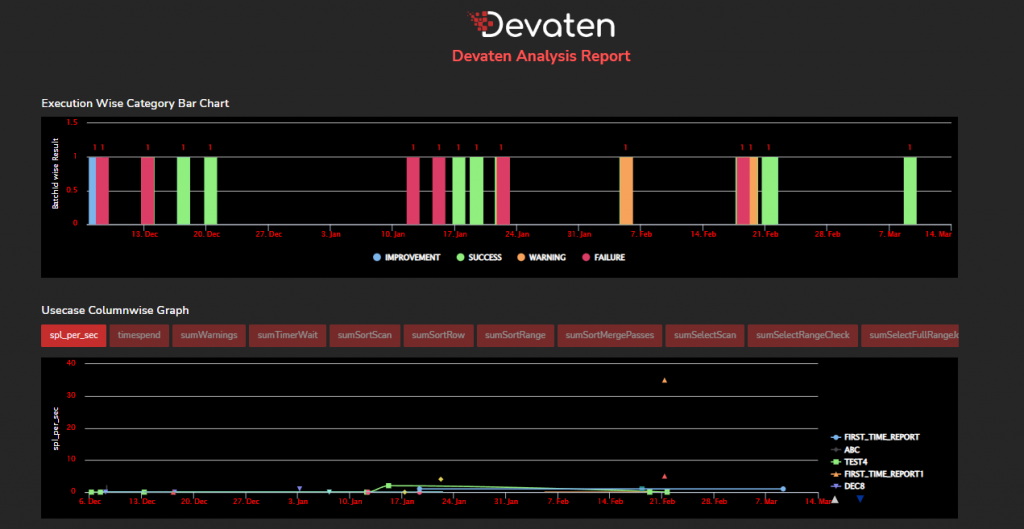
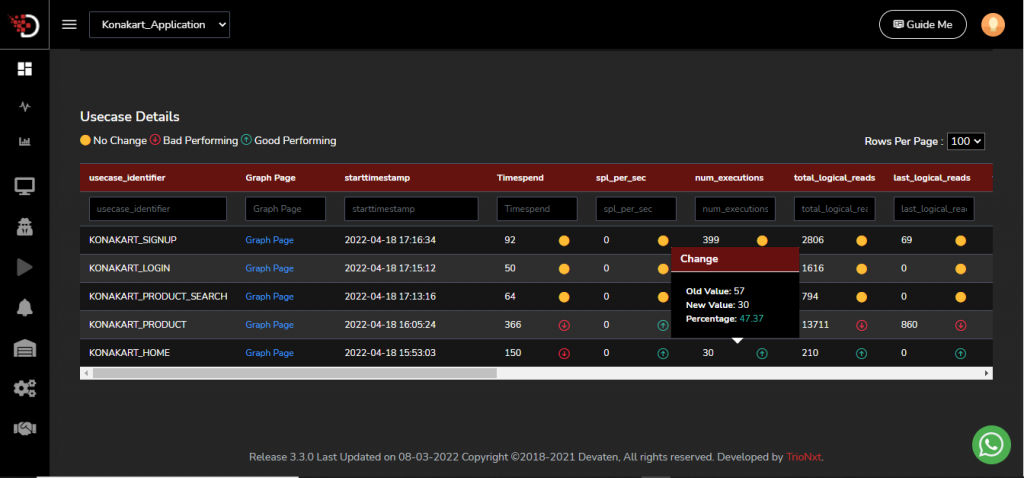
Devaten is perfect match for ETL performance testing we measure performance similar way than all market leaders but our power is comparison to baseline run. Example when data grows devaten comparision alerts to users if there deviation more than there is define in threshold.
You can configure in to your ETL process devaten START & END REST API class.
For testing you need:
Curl.exe
jq-win64.exe
To make REST calls.
Then add config.json file to configure Devaten
{"serviceUrl":"https://app.devaten.com/",
"username":"mail.gmail.com",
"password":"xxxxx",
"applicationIdentifier":"07079791-8d4a-4f2b-9a92-37f51dd3b2b9",
"recordingStopperTime":15,"useCaseId":"actor"}
Then configure in to your ETL tool
@echo off
more config.json | jq-win64.exe ".serviceUrl" >> temp.txt
set /p serviceUrl=<temp.txt
del -f temp.txt
del -f response.json
more config.json | jq-win64.exe ".username" >> temp.txt
set /p username=<temp.txt
del -f temp.txt
more config.json | jq-win64.exe ".password" >> temp.txt
set /p password=<temp.txt
del -f temp.txt
more config.json | jq-win64.exe ".recordingStopperTime" >> temp.txt
set /p recordingStopperTime=<temp.txt
del -f temp.txt
more config.json | jq-win64.exe ".useCaseId" >> temp.txt
set /p useCaseId=<temp.txt
del -f temp.txt
more config.json | jq-win64.exe ".applicationIdentifier" >> temp.txt
set /p applicationIdentifier=<temp.txt
del -f temp.txt
:start
"grant_type=password" -d "username=%username%" -d "password=%password%" >> temp.txt
more temp.txt | jq-win64.exe ".access_token" >> accessToken.txt
set /p accessToken=<accessToken.txt
del -f temp.txt
del -f accessToken.txt
if %accessToken%==null (goto :showMessage)
curl -v -H "Authorization: Bearer %accessToken%", -H "applicationIdentifier:%applicationIdentifier%" -X GET %serviceUrl%devaten/data/startRecording?usecaseIdentifier="GetCustomer"
START YOUR ETL….
curl -v -H "Authorization: Bearer %accessToken%", -H "applicationIdentifier:%applicationIdentifier%" -X GET %serviceUrl%devaten/data/stopRecording?usecaseIdentifier="GetCustomer&inputSource=batFile" -i
After run, you will get detailed* analytics – Result Notification.
Recording Use case Report
Details are as follows,
Summary Report:
UsecaseIdentifier: GetCustomer
execcount [Old] : 214.0 ,[New] : 12.0 , [Result] : 94.39
docsExamined [Old] : 0.0 ,[New] : 3010.0 , [Result] : -3010.0
needTime [Old] : 297.0 ,[New] : 2010.0 , [Result] : -576.77
Test Result : -1164% Failure
And link to report where you can see overall history.

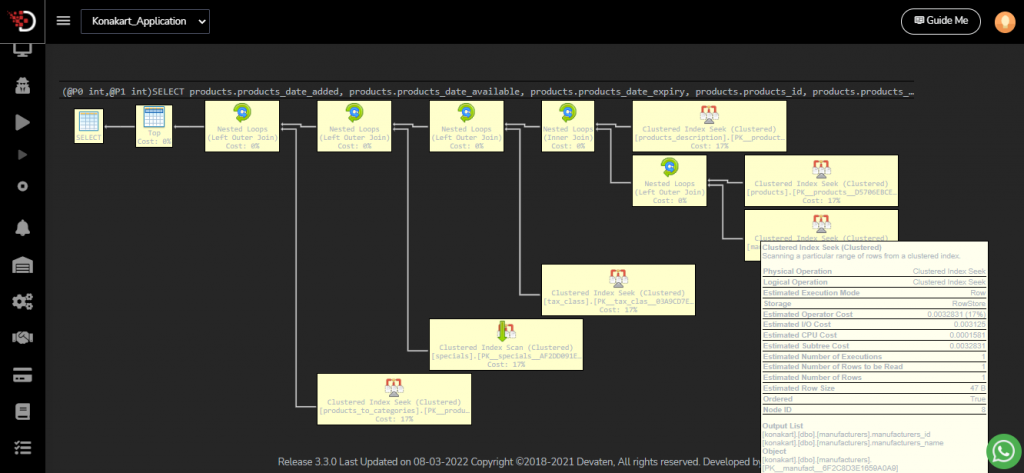
This are the most executed SQLs with comparation.


With help of devaten help there is can be right away see different trend in your executions.

Visit Us
Contact Us
Explore
Copyright © 2024 Devaten, All rights reserved.

