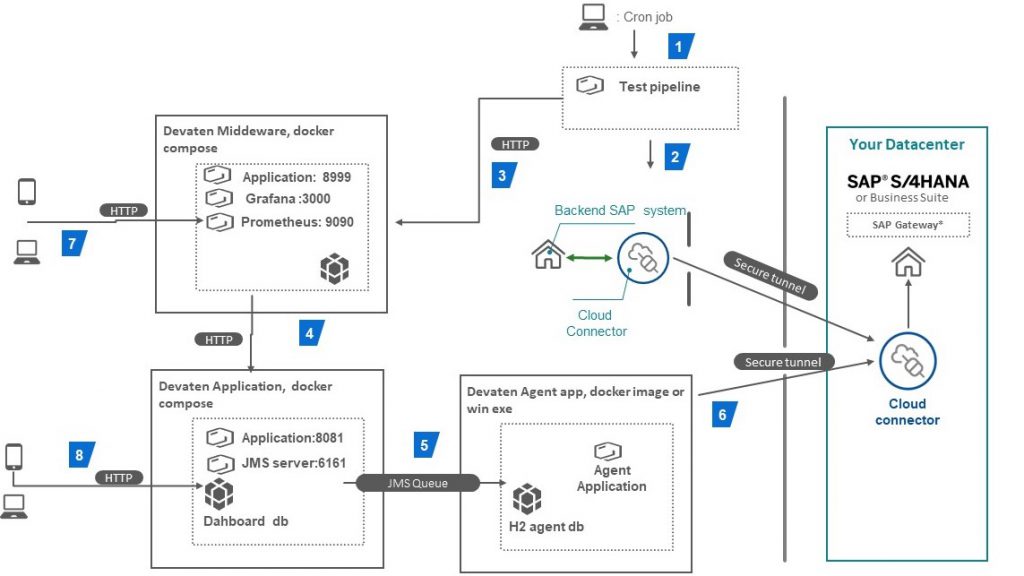
Devaten Architecture Diagram for All Supported Data Sources
Cron job launch test pipeline or similar.
Test tool hit application, eg Jmeter, selenium, batch job…
When the test starts: test tool sends a Start recording request, when the test stops send a STOP recording request for each use case separately.
Devaten Middleware app receives START authentication to Devaten app > start HTTP call Devaten app > run HTTP call every n.5 sec, > when receive STOP sends stop request to Devaten app.
Devaten app receives HTTP START > put message request to START to JMS queue, RUN put message request to get RUN & “WHO IS ACTIVE” data to JMS queue, STOP put message request to STOP to JMS queue, All services response with data in JSON format.
Agent app get messages from the JMS queue, connect to SAPHANA DB, and execute queries and store results to H2 DB
Middleware app get response and store results to Prometheus DB, After START data is available on the Grafana dashboard.
Devaten app store START, RUN, STOP response data and validate the result, and sends notifications to users, eg Jira, email. History data is available on the Devaten dashboard with detailed metrics with SQL statements with query EXPLAIN