In many cases, the software initially works according to the functional requirements and is green-lighted for delivery, but it may slow down over time and with new releases, due to database performance issues. Read this guide to find out how you can use devaten as a plugin in NeoLoad. So Neoload user can see devaten dashboard results in their tool. This is helpful as they can see the database bottlenecks during the load testing run.
By Mikko Larkela – Founder & CEO at Devaten
When measuring database performance is done as part of automation testing, I experience interesting and useful results. Here are the areas for running one of the test cases:
Number of SQL statements
Separately broken down by select, insert, delete, update quantities
Lock waiting time
Rollbacks
Database server CPU time and percentage
The number of rows read, the number of rows in the database during the test case.
Why is accuracy an asset?
The service change made for the new column is therefore very poorly implemented, there are iteration lists and several unnecessary SQL statements are executed to the database.
Problems are only beginning to arise in the process of producing, several batches notice slowness, and web services are also detected slowly.
This will start to find out where the fault and the time will easily pass for several days before the fault is found. In many cases, due to such a small change, a comprehensive performance test is not carried out, but problems only begin to arise in production. Enterprise application comprehensive performance monitoring usually requires a lot of calendar time and correcting the findings delays the entire delivery schedule.
Now that we are adding database monitoring as part of the application’s automation tests, we can immediately catch the number of SQL statements that have changed in different services. In this case, for example, the change to the general service affected many different use cases.
Another similar problem occurs when a developer changes a SQL statement that is in continuous use, for example by adding a new subquery to the query. In this case, select starts scanning the index several times. This type of problem cannot be found in even smaller test databases, as the database engine reads the entire table quickly. Slowness only begins to come when the application is tested in a production-like environment.
More than half of application performance bottlenecks originate in the database, but most application teams have little or no visibility into database performance. “AppDynamics”.
More chances of success
When we add database monitoring as part of the application’s normal automation tests as well as performance tests, we immediately catch up with the number of rows read that have changed in different services compared to the situation before the change. In large enterprise projects, database monitoring as part of performance monitoring significantly speeds up the correction of performance issues, and this way the entire project has a better chance of success.
What power does Devaten provide to Neoload?
Devaten is a leader in use case-based database performance monitoring and NeoLoad is a leader in load testing, but while putting the extra load on application NeoLoad don’t have the complete details about the database for the specific use-case and that is the important information devaten is providing to the Neoload so user can check the live details and act on it.
With these details devaten also provides the complete statistics to NeoLoad so users can check the complete status about the Spike reason along with events.
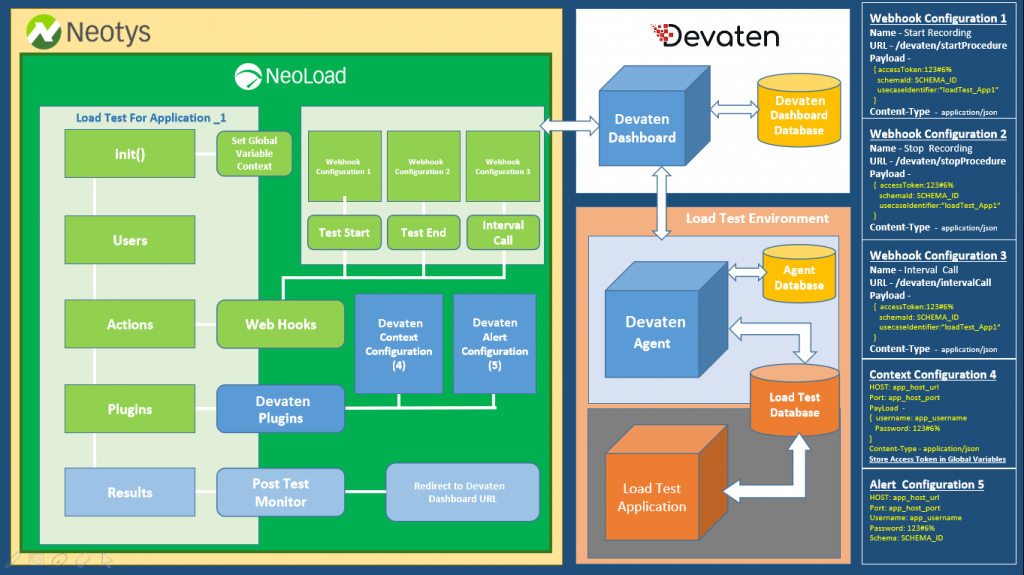
Let’s go with the architectural diagram of how devaten integrates with NeoLoad. We will check the architectural diagram first and then step by step will see how to configure it.
In the above diagram, we have configured the application context and then use that application context for WebHooks to call the devaten.
The application context will set through the NeoLoad GUI and the webhook will use that information.
NeoLoad webhook will communicate with devaten API to Start, Stop and Run Details. That webhook will store the information to the NeoLoad dashboard.
Now will check how to setup Devaten plugin to NeoLoad
Add devaten plugin to NeoLoad. Devaten team will provide you with the devaten plugin to configure it in NeoLoad GUI.
Paste that provided jar file to PROJECT_FOLDER/lib/extlib folder. You will see the new plugin in NeoLoad GUI -> Action -> Database -> devaten.
Now create a new user path by right-clicking on User Paths -> Create a User Path -> New User Path
It will open one popup now enter plugin name “devaten”, it will create new user Path with name “devaten” along with three folder
Init
Actions
End
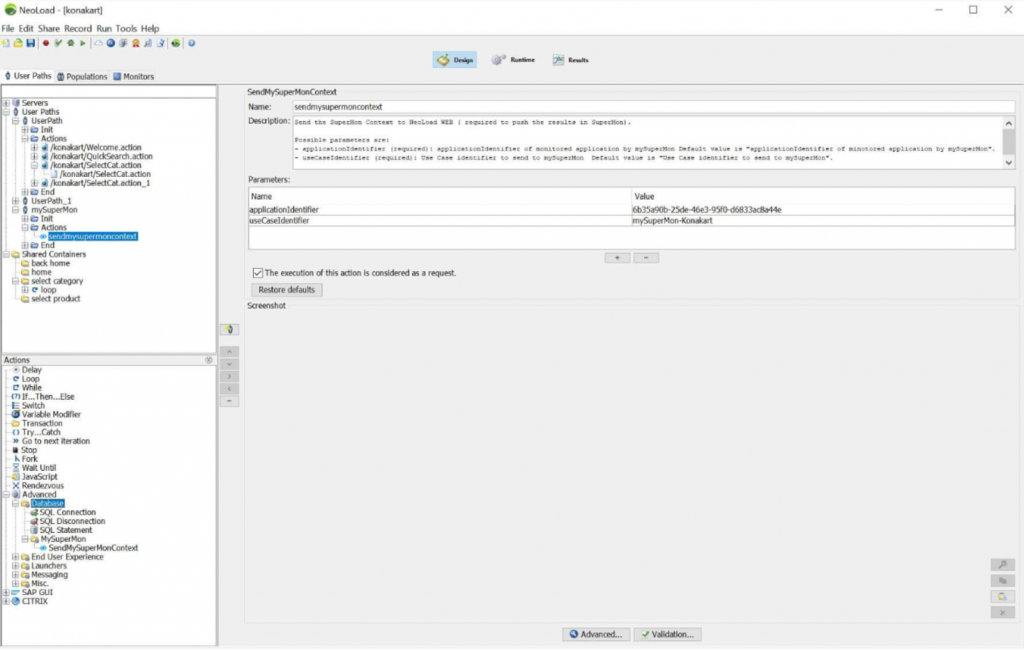
Now with the action, you need to drag and drop the SendDevatenContext to action. That will set the context of your application.
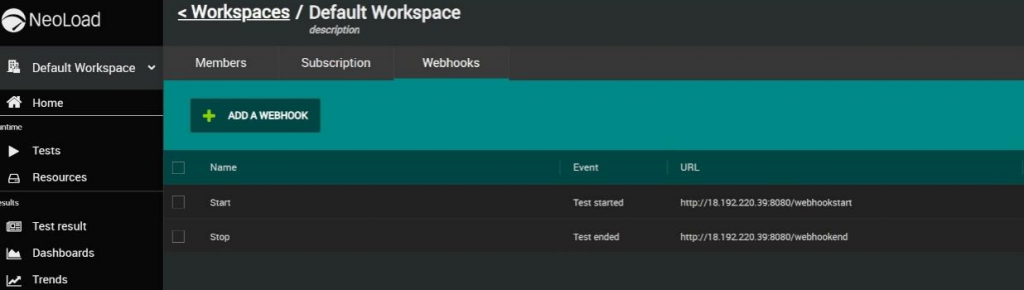
Webhooks to send start recording and stop recording calls.
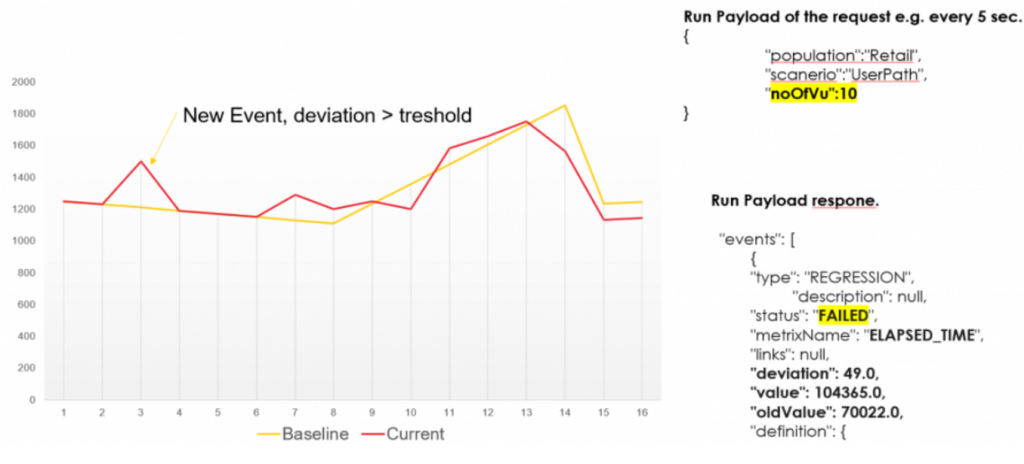
When all setup is done, there can be defined database metrics to neoload saas and devaten is all the time comparing execution to baseline run.
And if deviation is higher than there is defined in the threshold event is created.
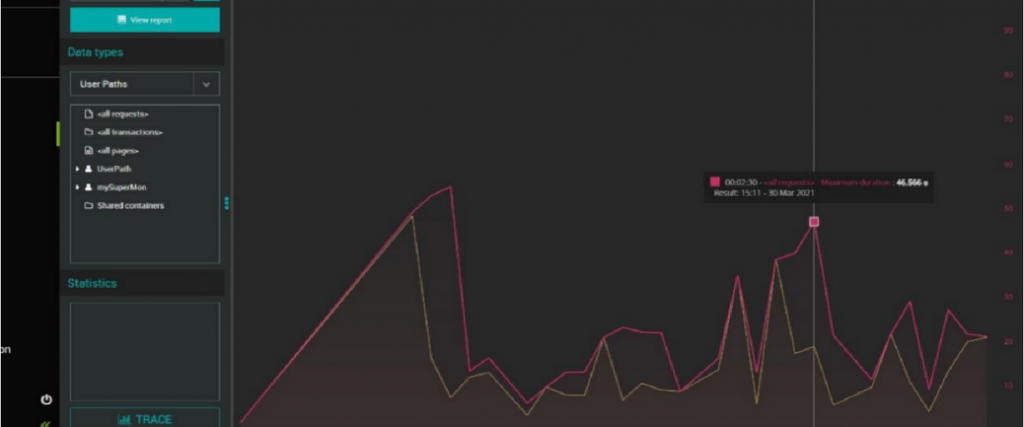
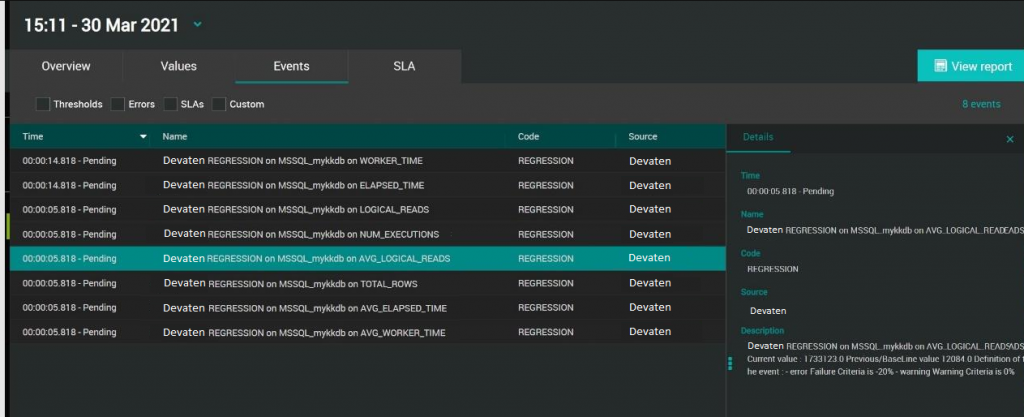
Neoload Saas new event
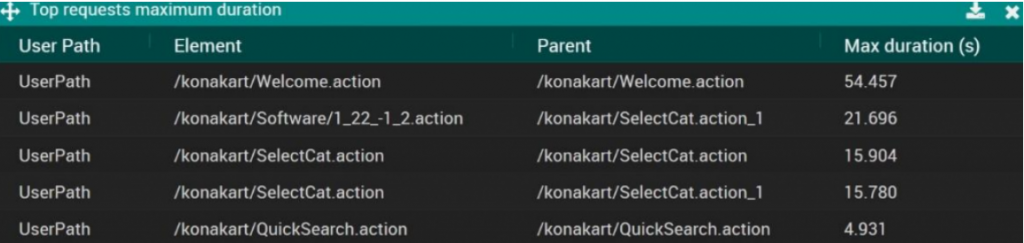
On Neoload Saas user can see highest durations.
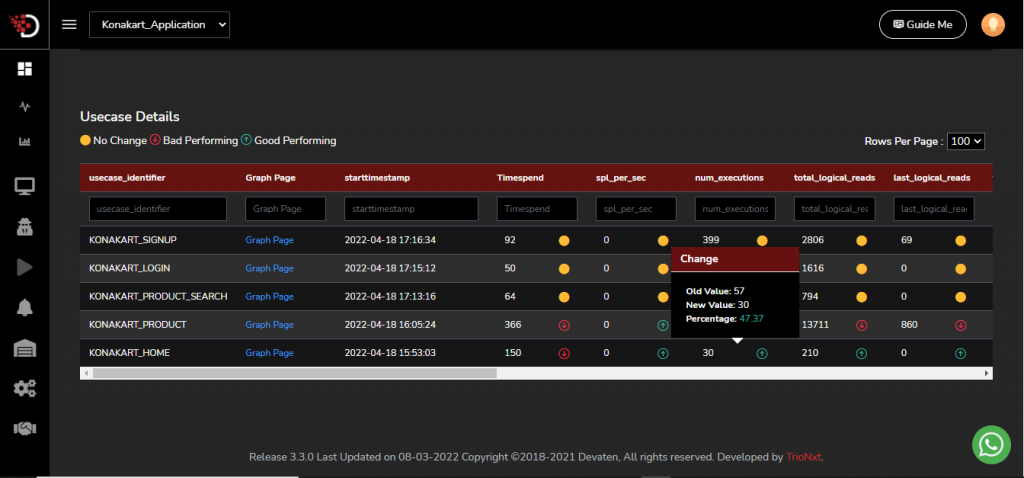
Devaten is providing a new innovation to comparing SQL statements to baseline run.
User can easily see what has changed from baseline and root cause analytics fast. Rows read value has increased a due new subquery,
Old Value 1040 New Value 1440240
Yellow color means that queries were not present on baseline run.
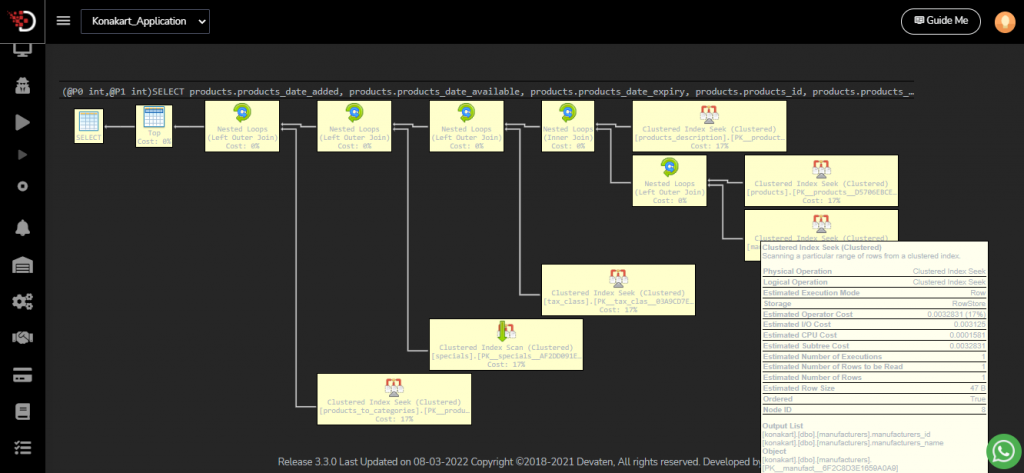
There is also available graphical explain and suggestion to add a new index.
Whats Devaten Doing?
Product Analysis Service gives you and your organization the following: The first time you run, you’ll see the performance status of the selected test cases. The product lists for you, for example, top10 best/worst performing use cases with comparison. The following periods shall catch those test cases where there have been changes compared to the previous test. With the help of the product, a further analysis can still be carried out on poorly performing services, in which actual SQL statements can be monitored with even more accurate monitors.
If you want to know more about Mikko’s presentation, the recording is already available here.
Established in 2013 as a software consultancy company, Devaten has worked with finance and healthcare businesses to enhance their software development projects. Taking its offerings to the next level, Devaten built a leading use case-based database application monitoring tool, with a unique approach to performance improvement early during software development. Headquartered in Turku, Finland.